Elastic Security is an enterprise-grade security operations platform that integrates SIEM, endpoint security (EDR/XDR), and cloud monitoring into a single unified workspace, enabling real-time detection, search, and response across distributed environments. In this lab, we onboard Windows and Linux endpoints via Fleet, ingest syslog logs from a Check Point firewall proxied through our gateway, configure SIEM detection rules, simulate attack execution, enforce endpoint prevention using Elastic Defend, perform host network containment, and correlate the threat sequence using AI-driven attack auto-discovery.
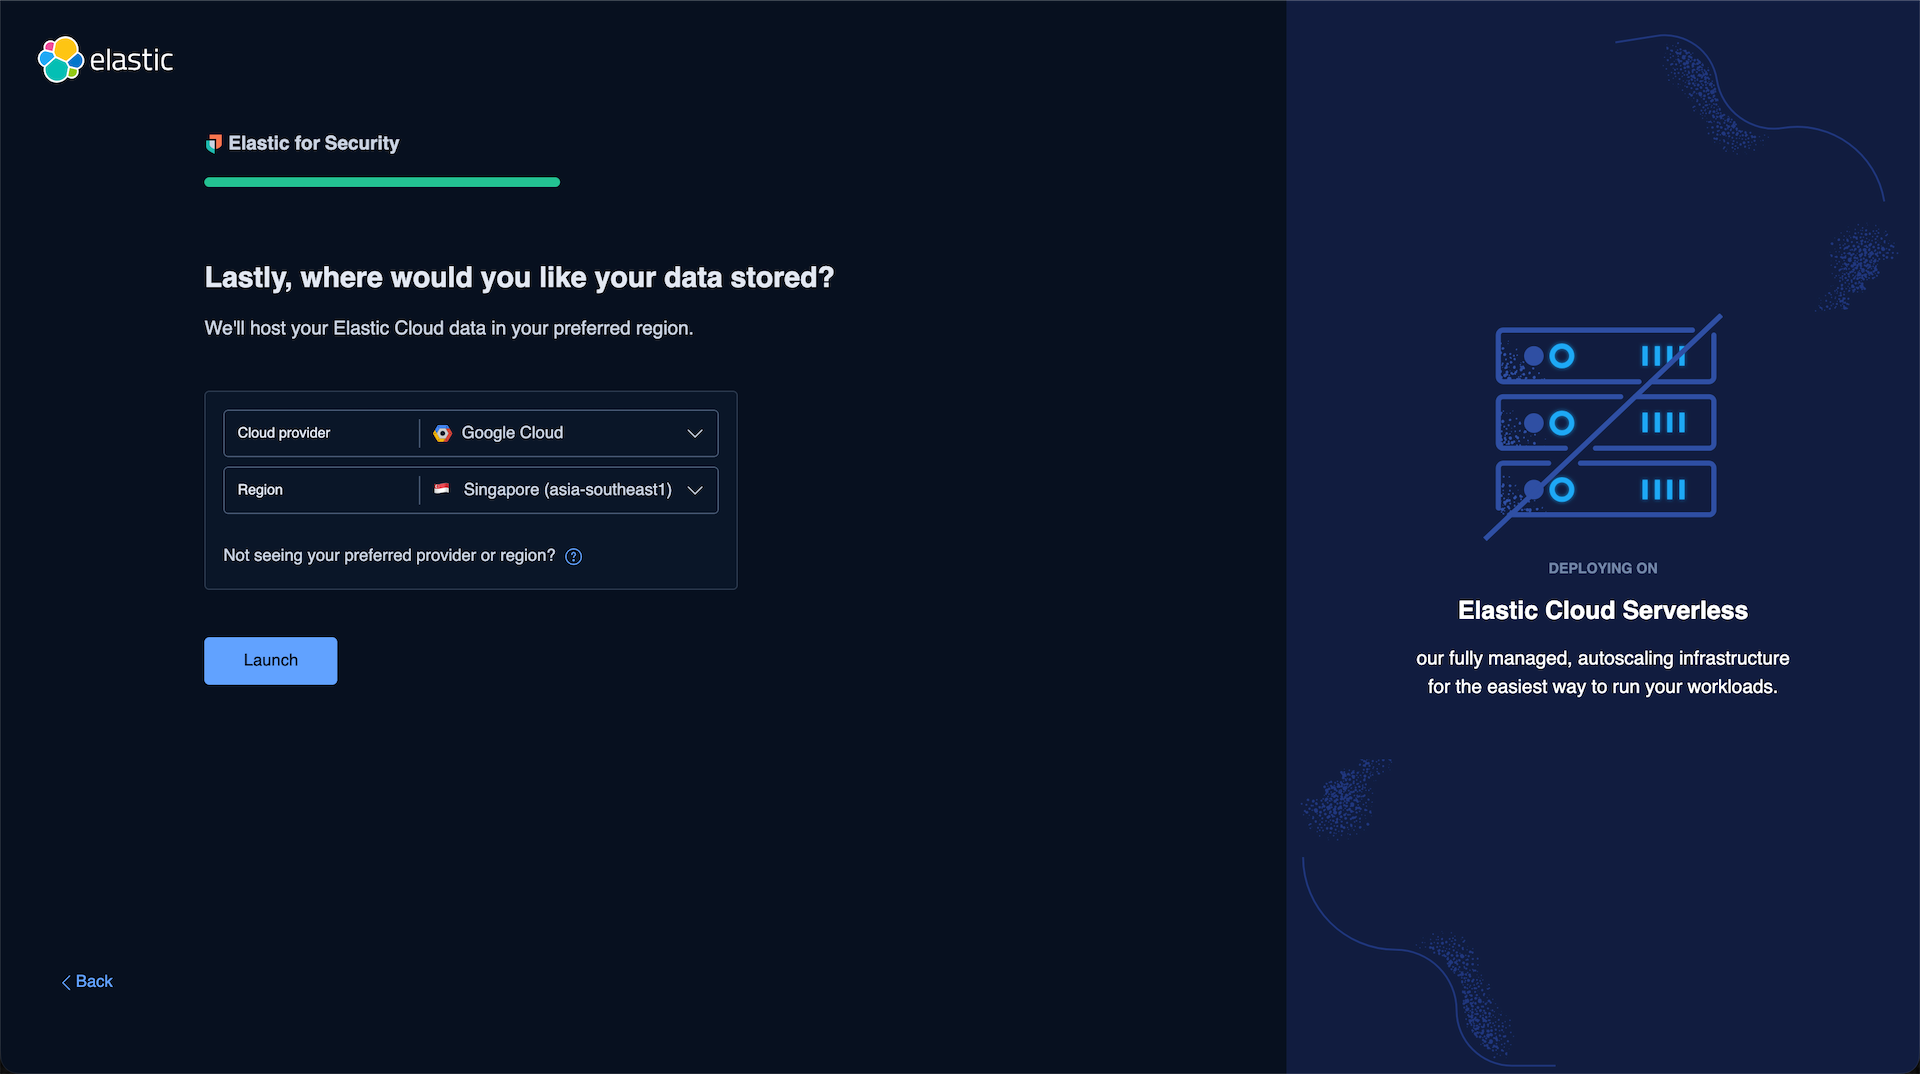
We select Google Cloud’s Singapore region to host our serverless deployment.
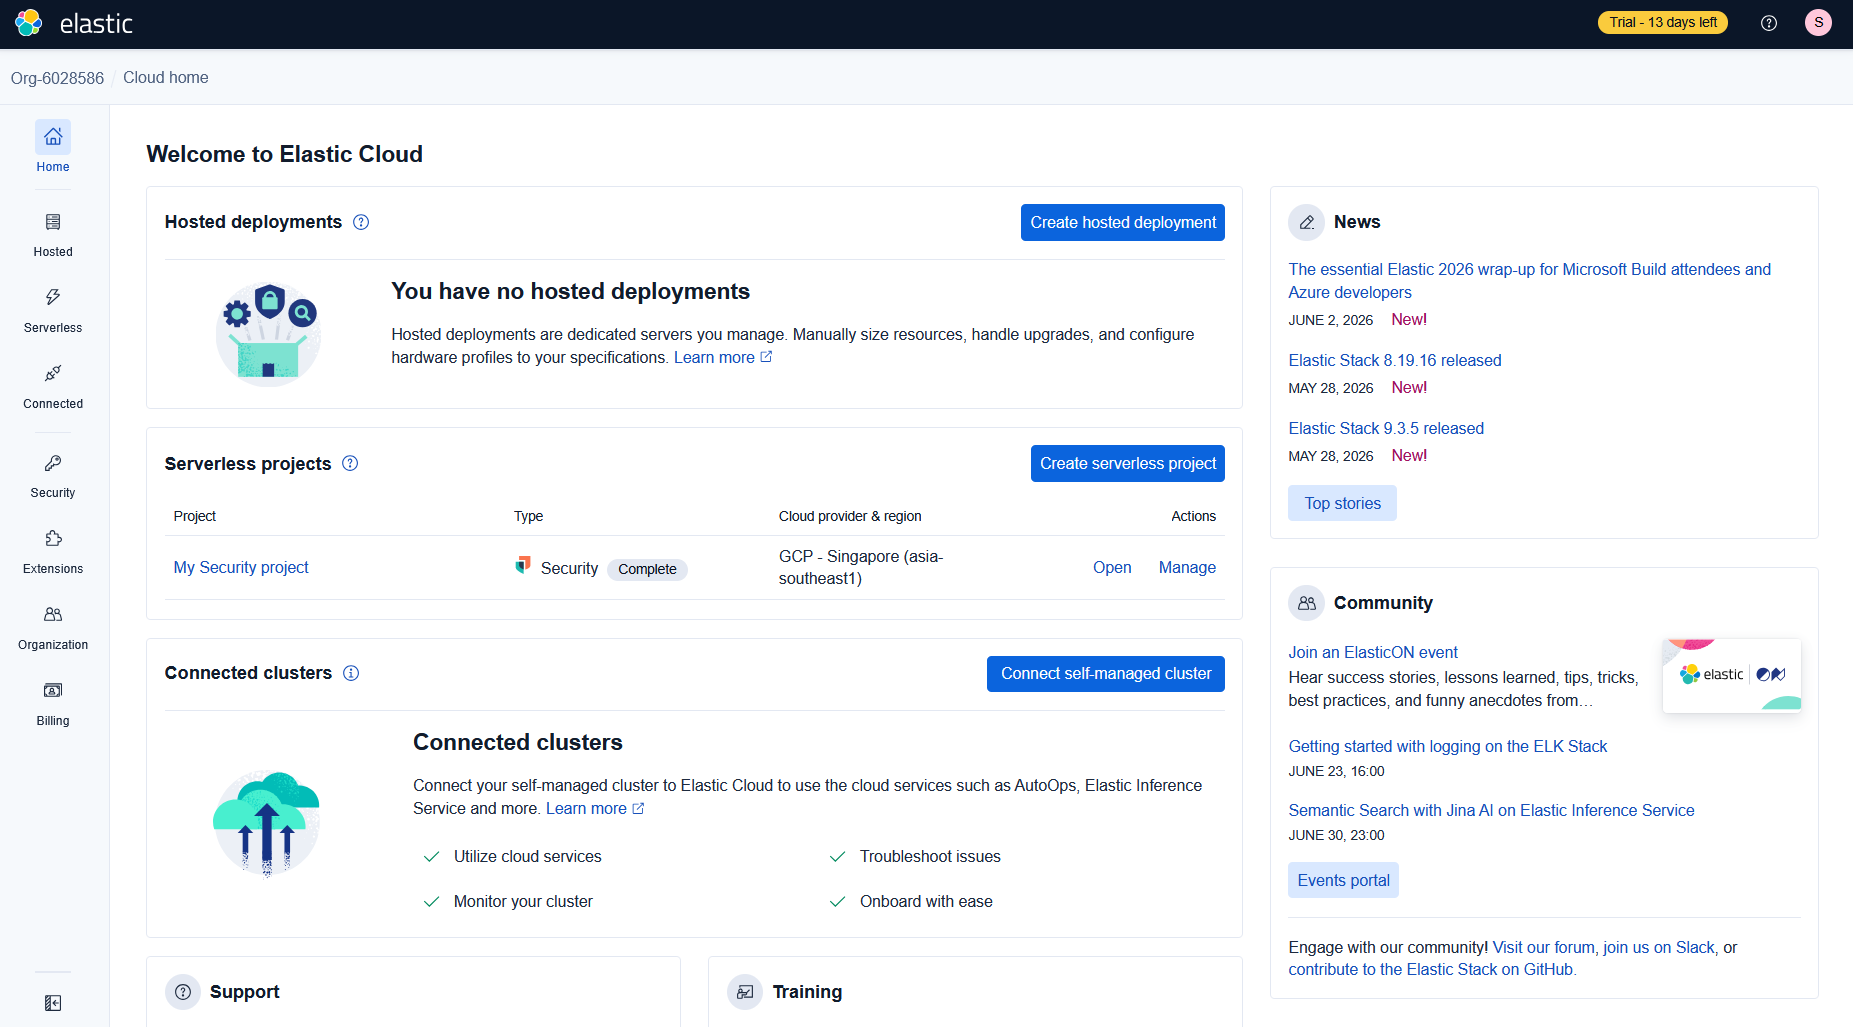
From our Elastic Cloud homepage, we access our serverless security project named My Security project.
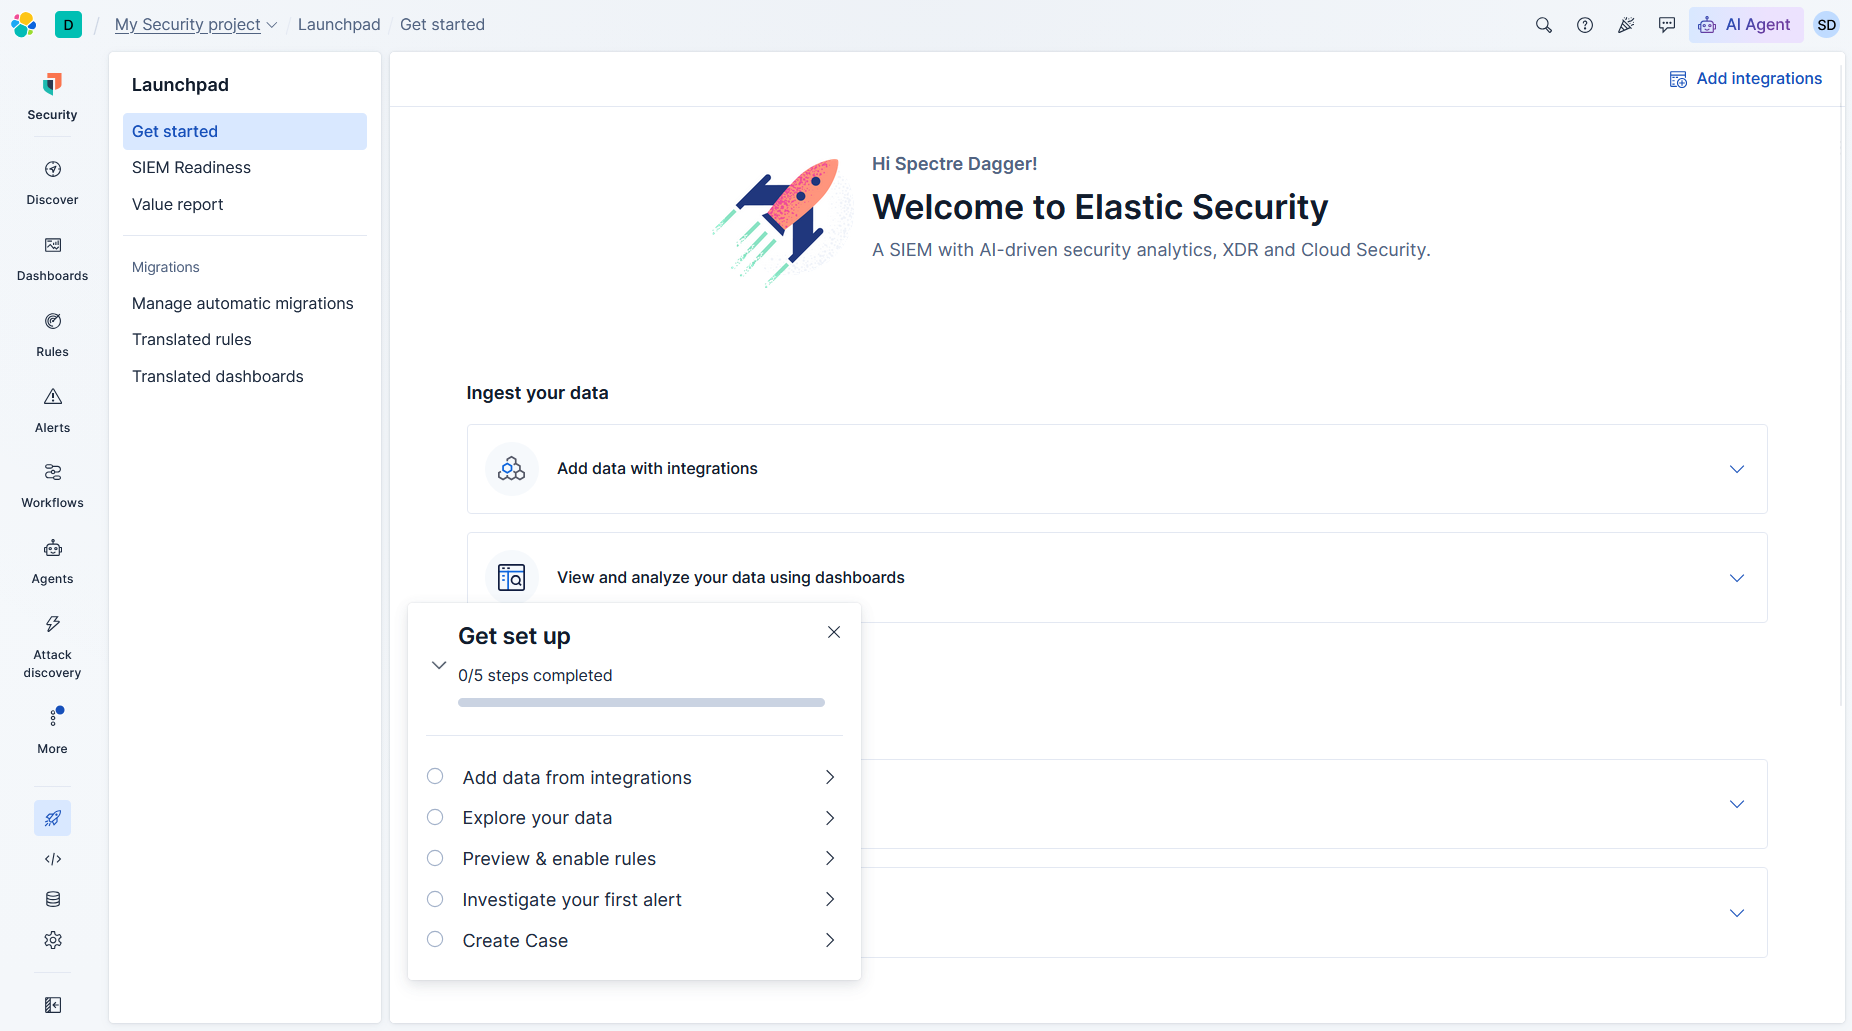
Opening the project, the welcome dashboard (Launchpad) displays the SIEM Readiness wizard, prompting us to add integrations and enroll agents.
Endpoint Onboarding & Fleet Management
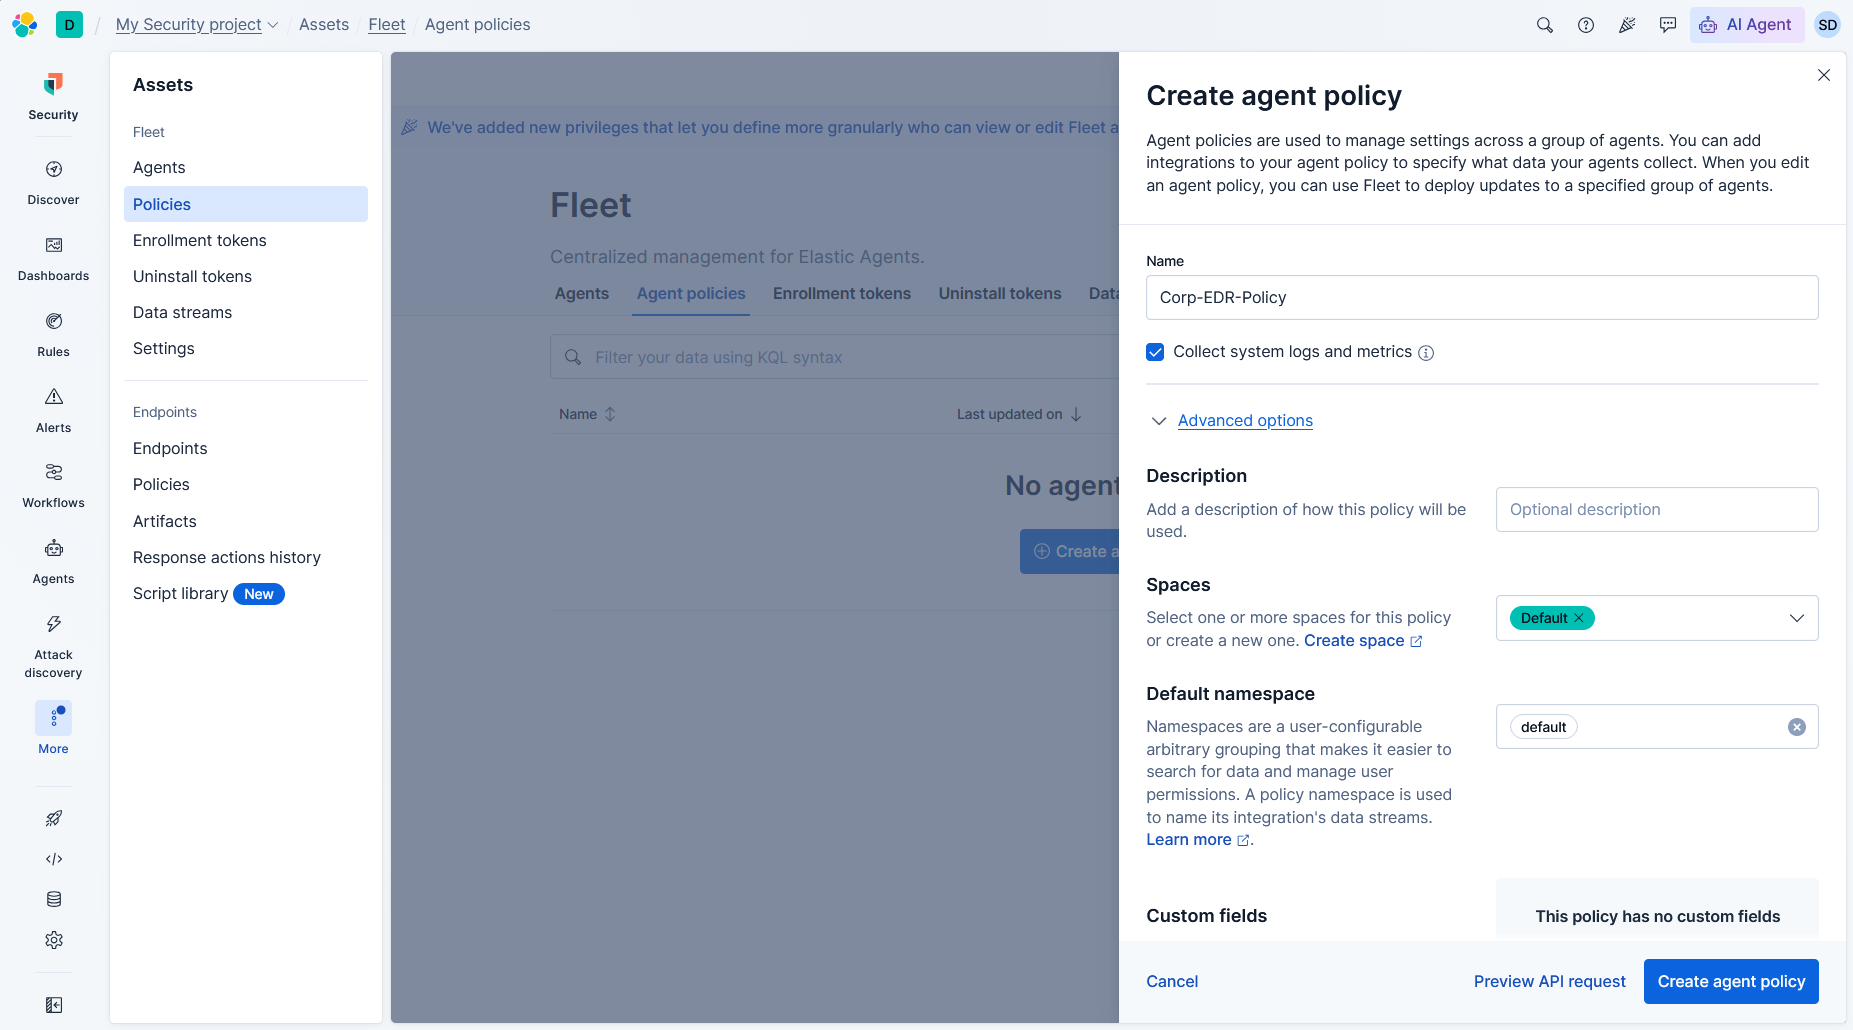
To manage policies and collect data across our hosts, we configure Fleet management. We navigate to Fleet and click Create agent policy to define a new policy named Corp-EDR-Policy.
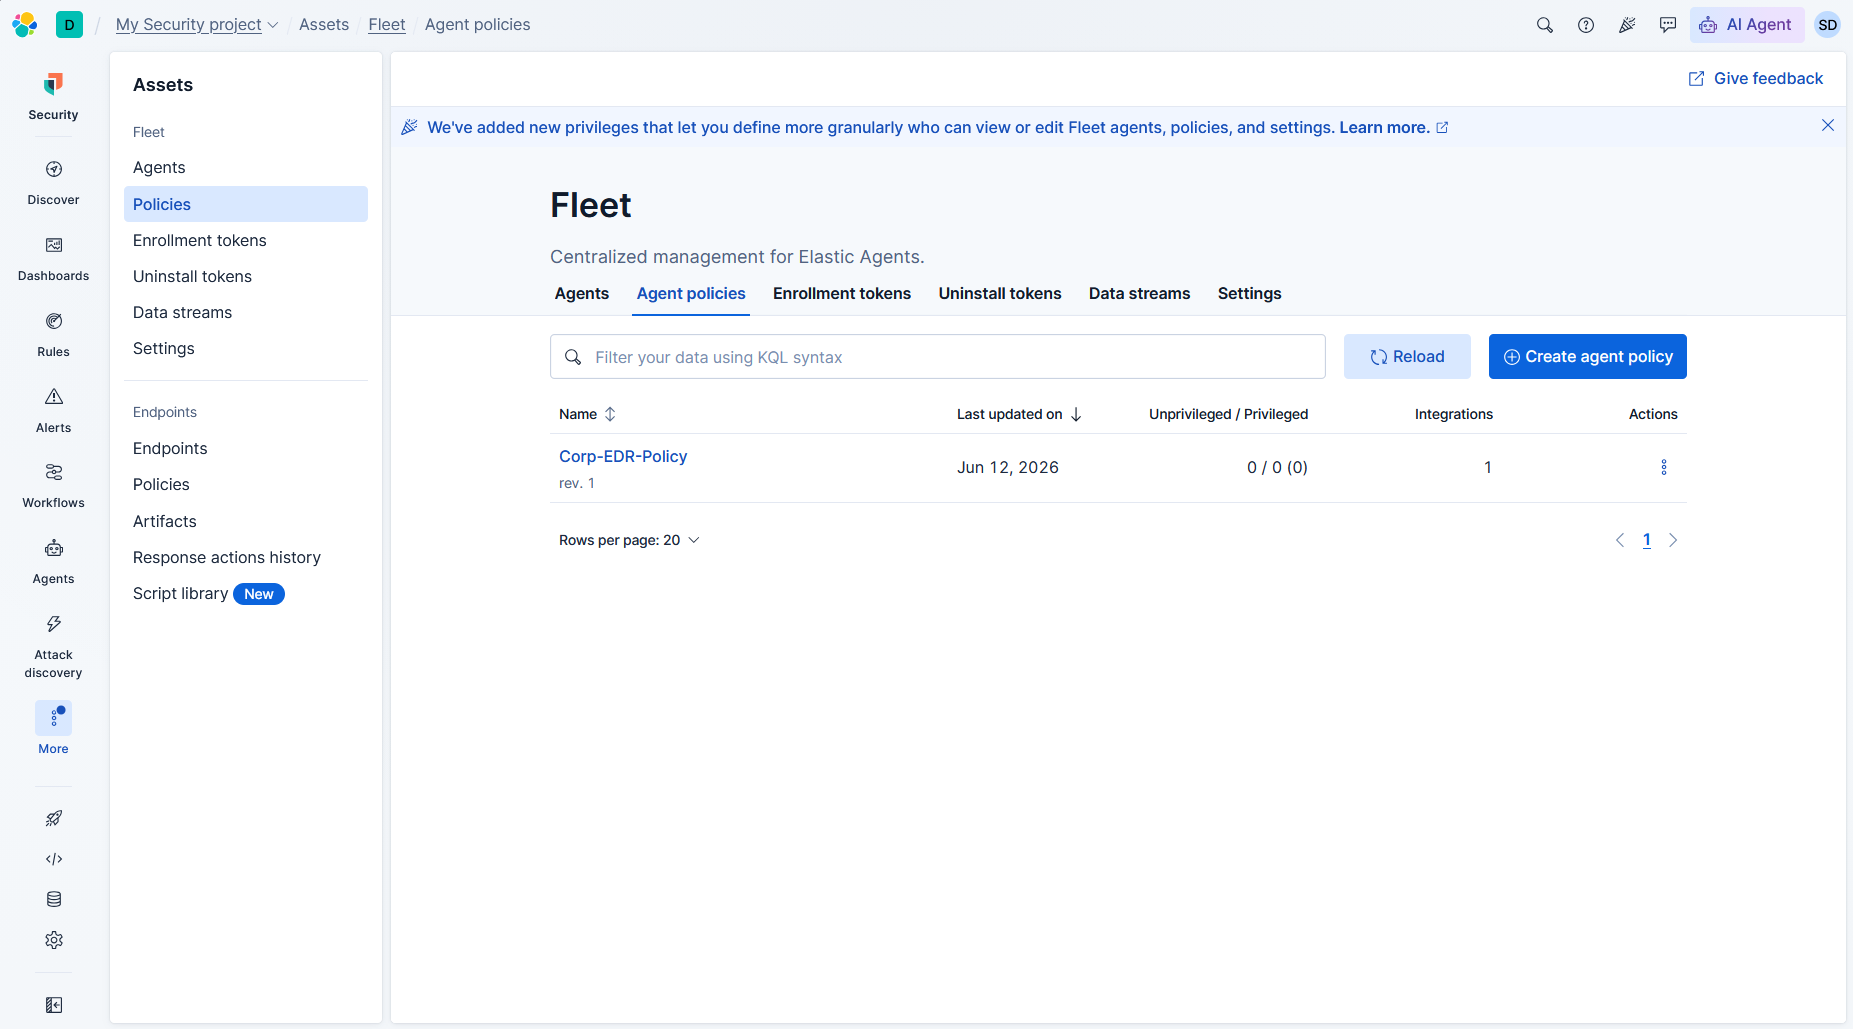
The policy is successfully created and registered under the active policies list.
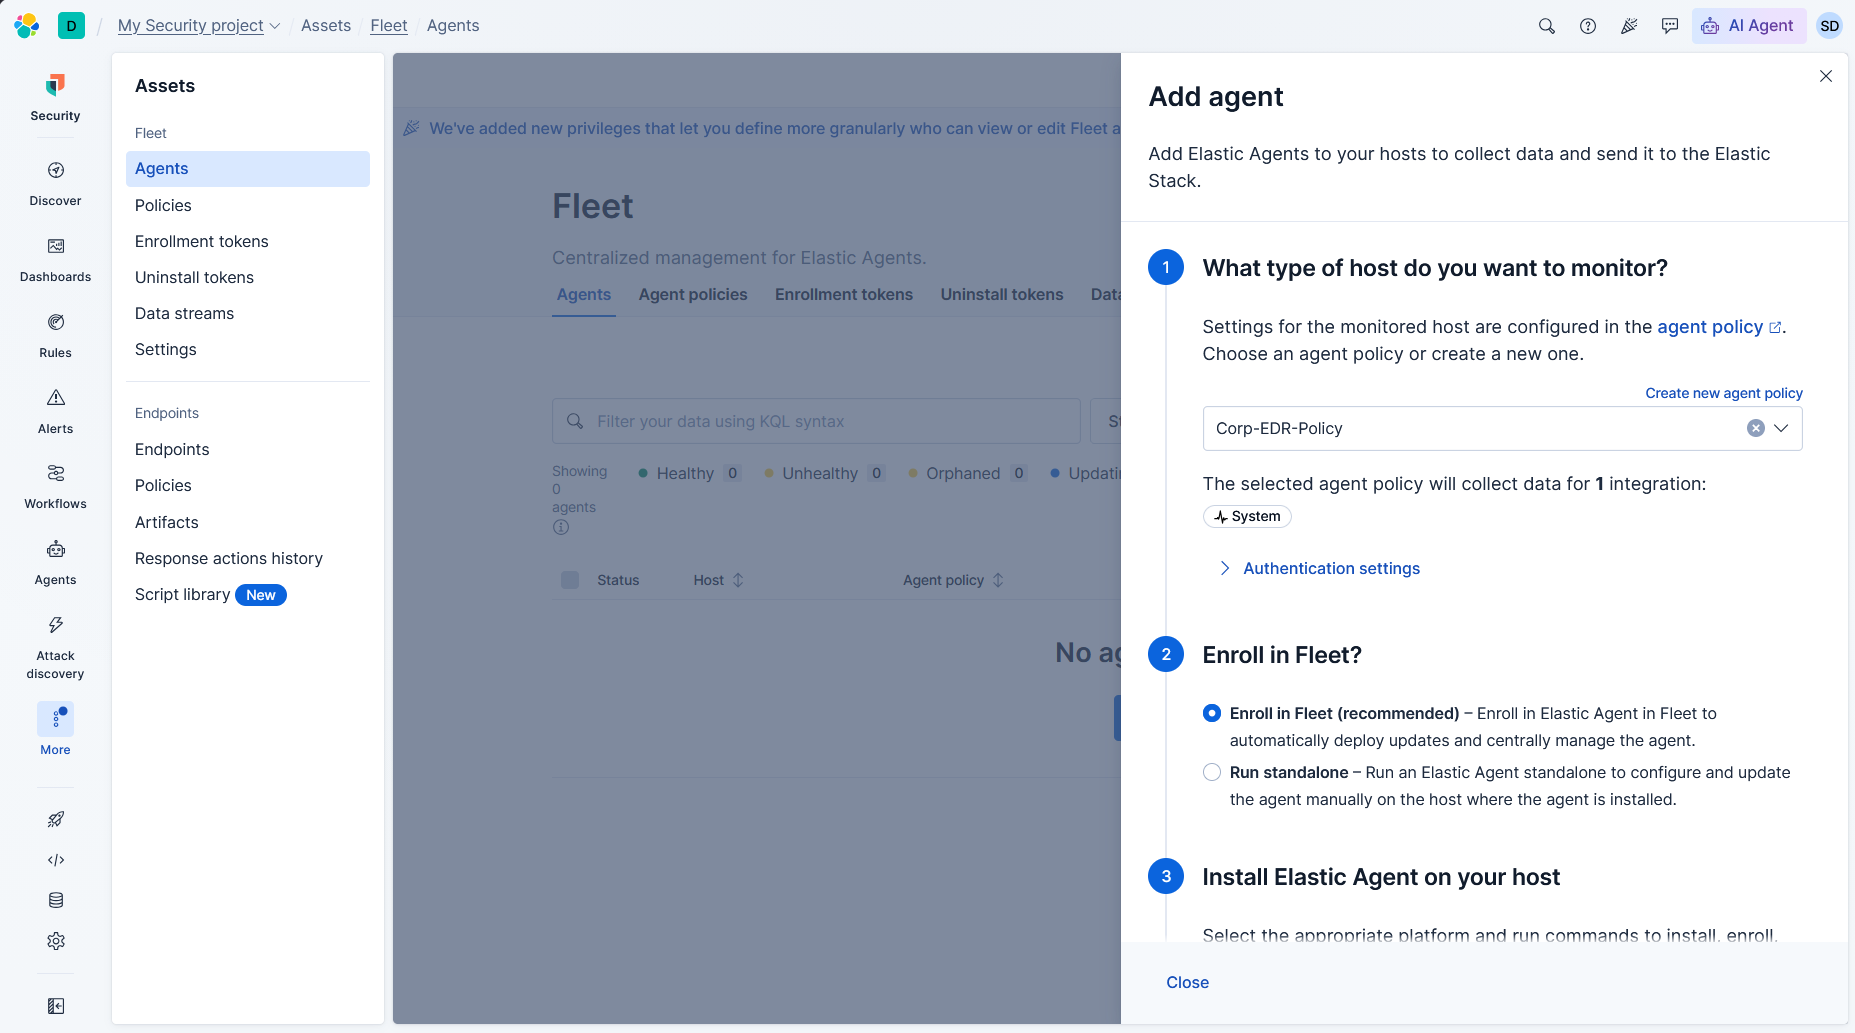
Next, we click Add agent and select the newly created Corp-EDR-Policy to generate the install commands.
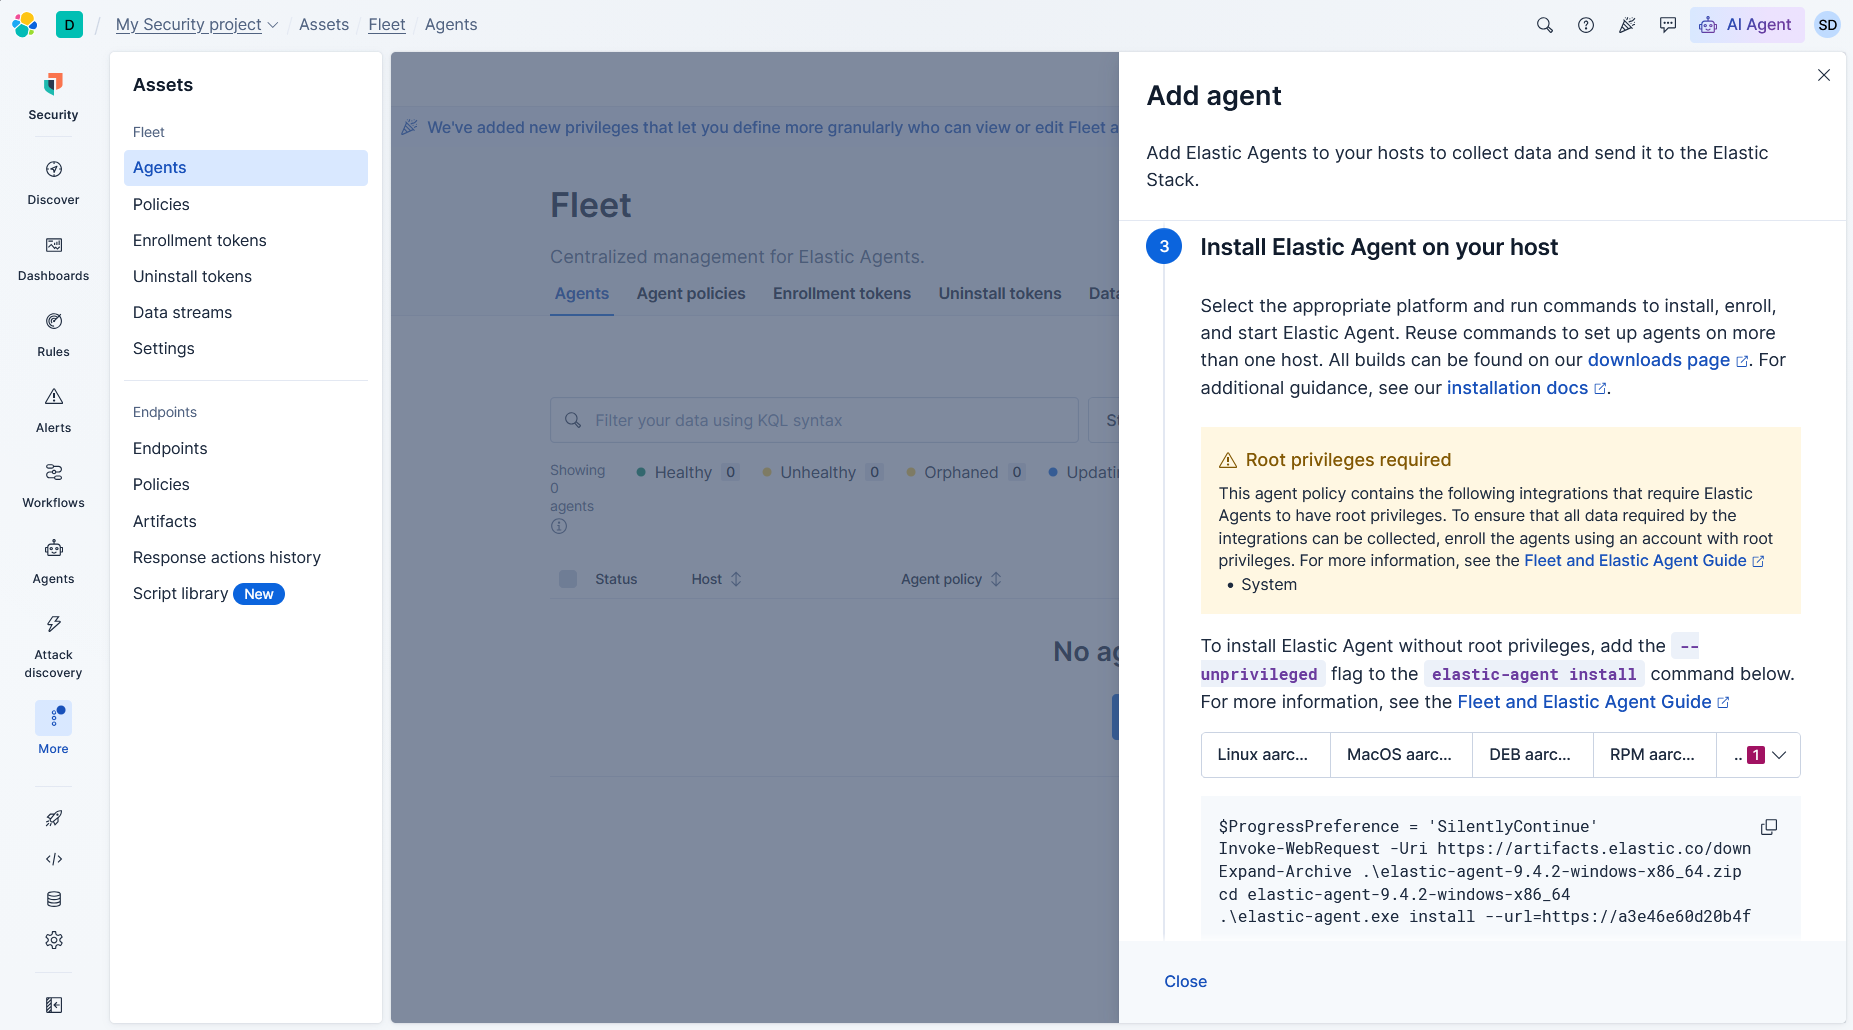
Elastic Fleet provides the powershell download and installation commands for the Windows client version 9.4.2.
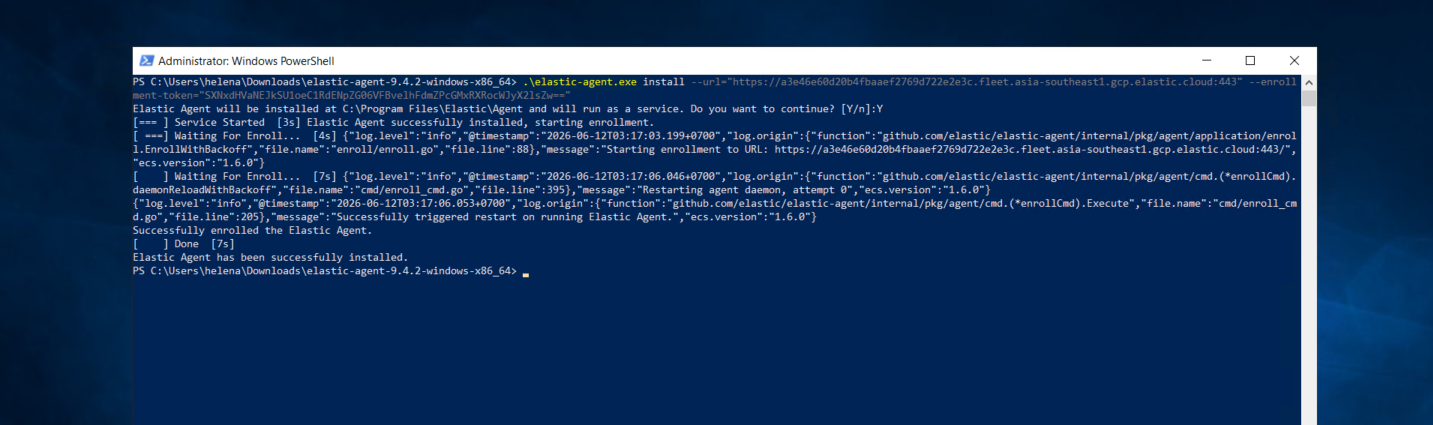
On the Windows client (WIN-22), we open an elevated PowerShell prompt, navigate to the downloads folder, and run the install script. The agent successfully installs as a service and enrolls in the Fleet console.
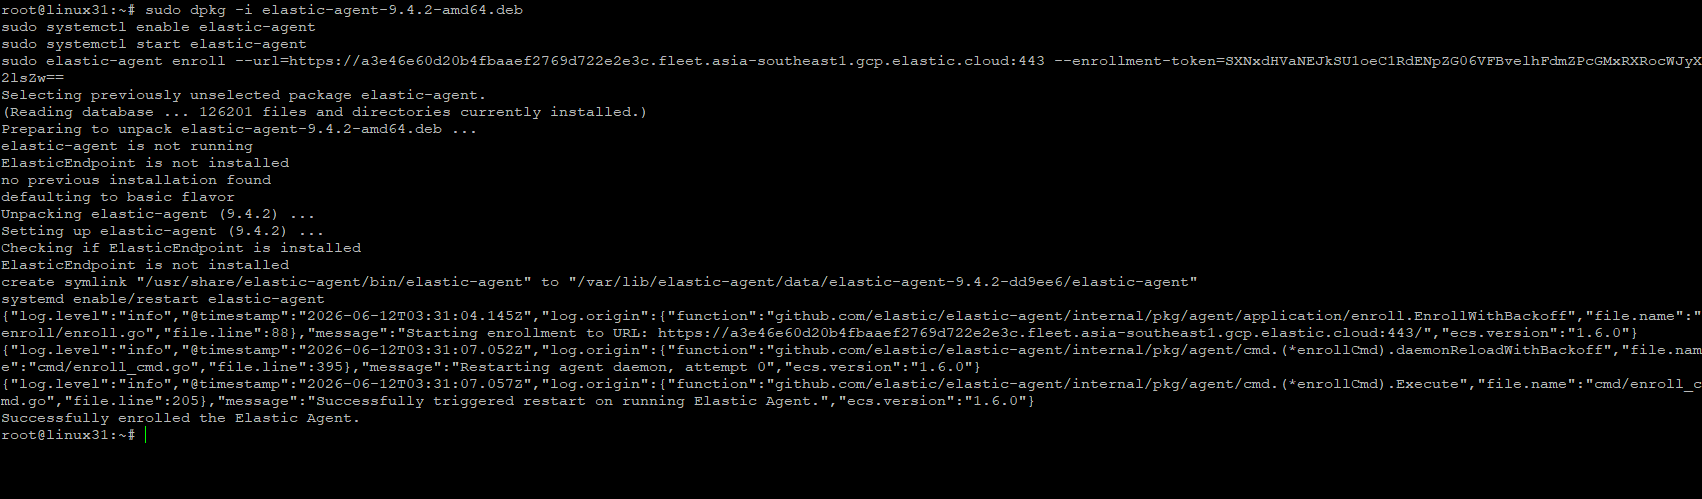
For our Ubuntu gateway host (linux31), we run the installation commands via SSH, downloading the Debian package, enabling the service via systemctl, and executing elastic-agent enroll.
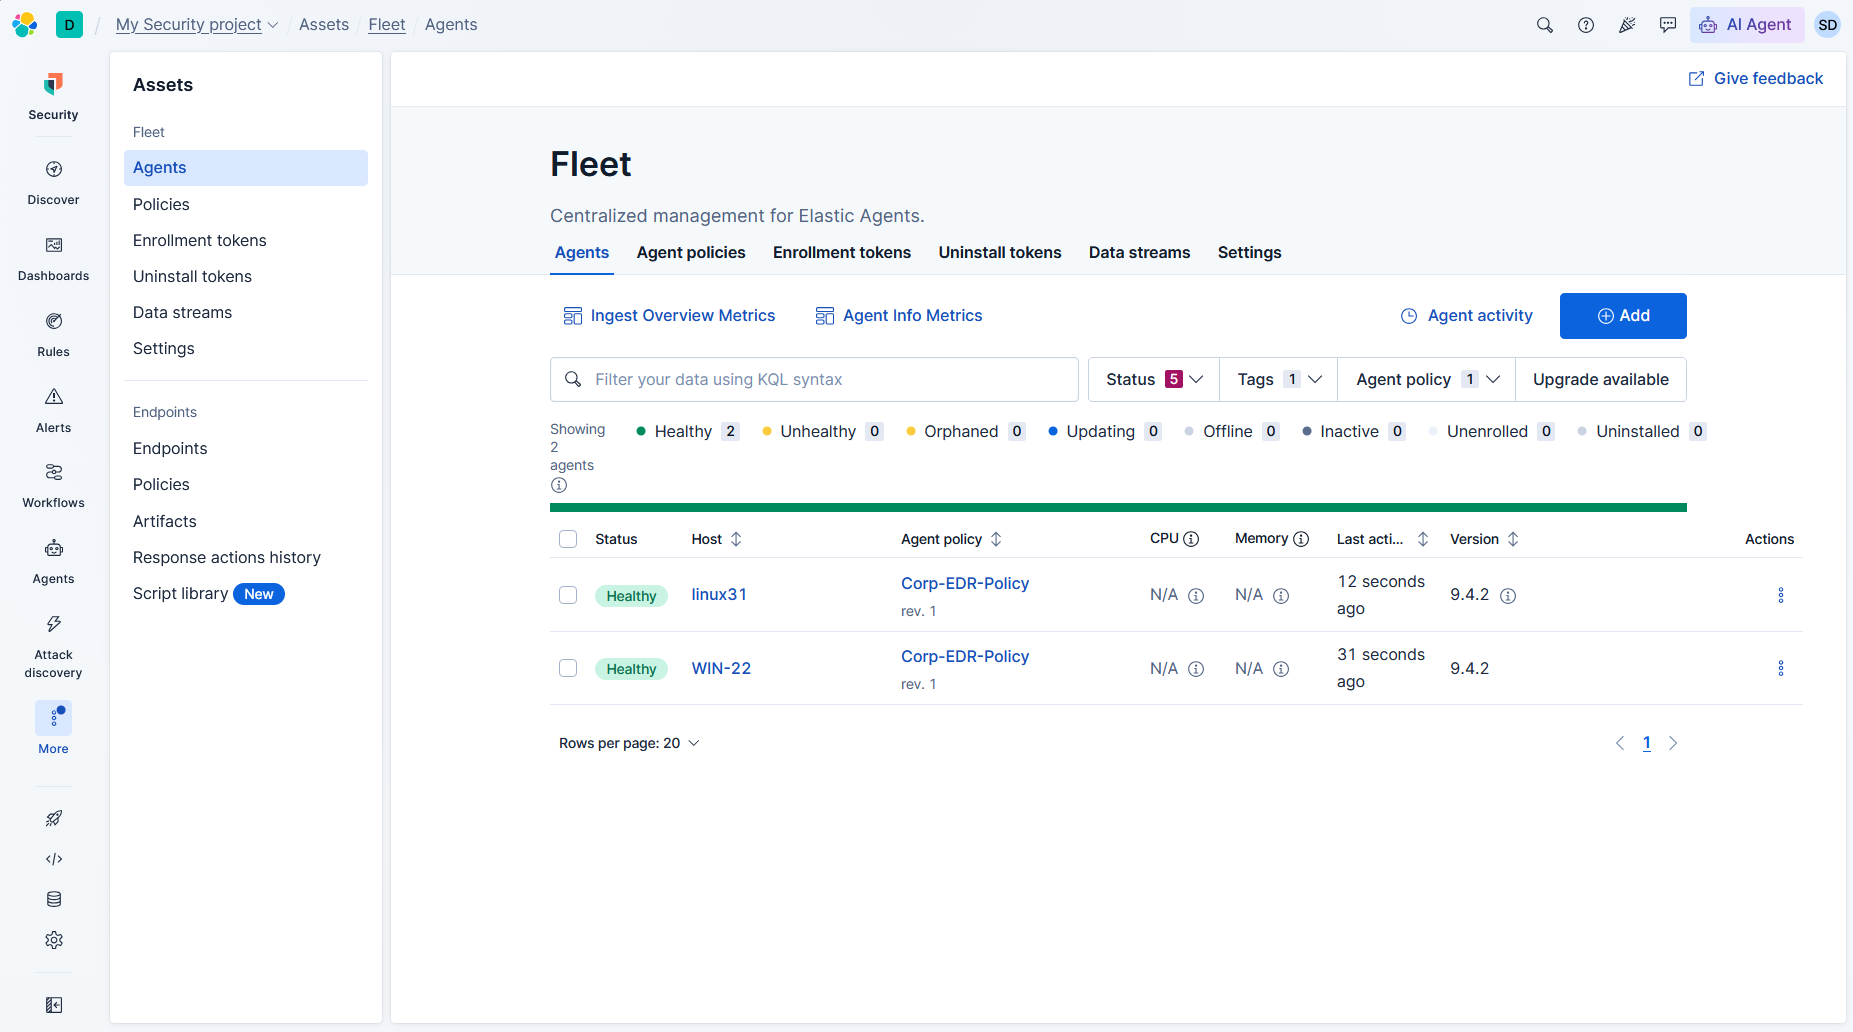
We verify the agent list in Fleet. Both linux31 and WIN-22 are healthy, active, and communicating with the manager.
Check Point Firewall Log Integration
With endpoint log sources onboarded, we enable perimeter network logging. We navigate to Fleet integrations, search for the Check Point integration, and name the integration configuration checkpoint-1.
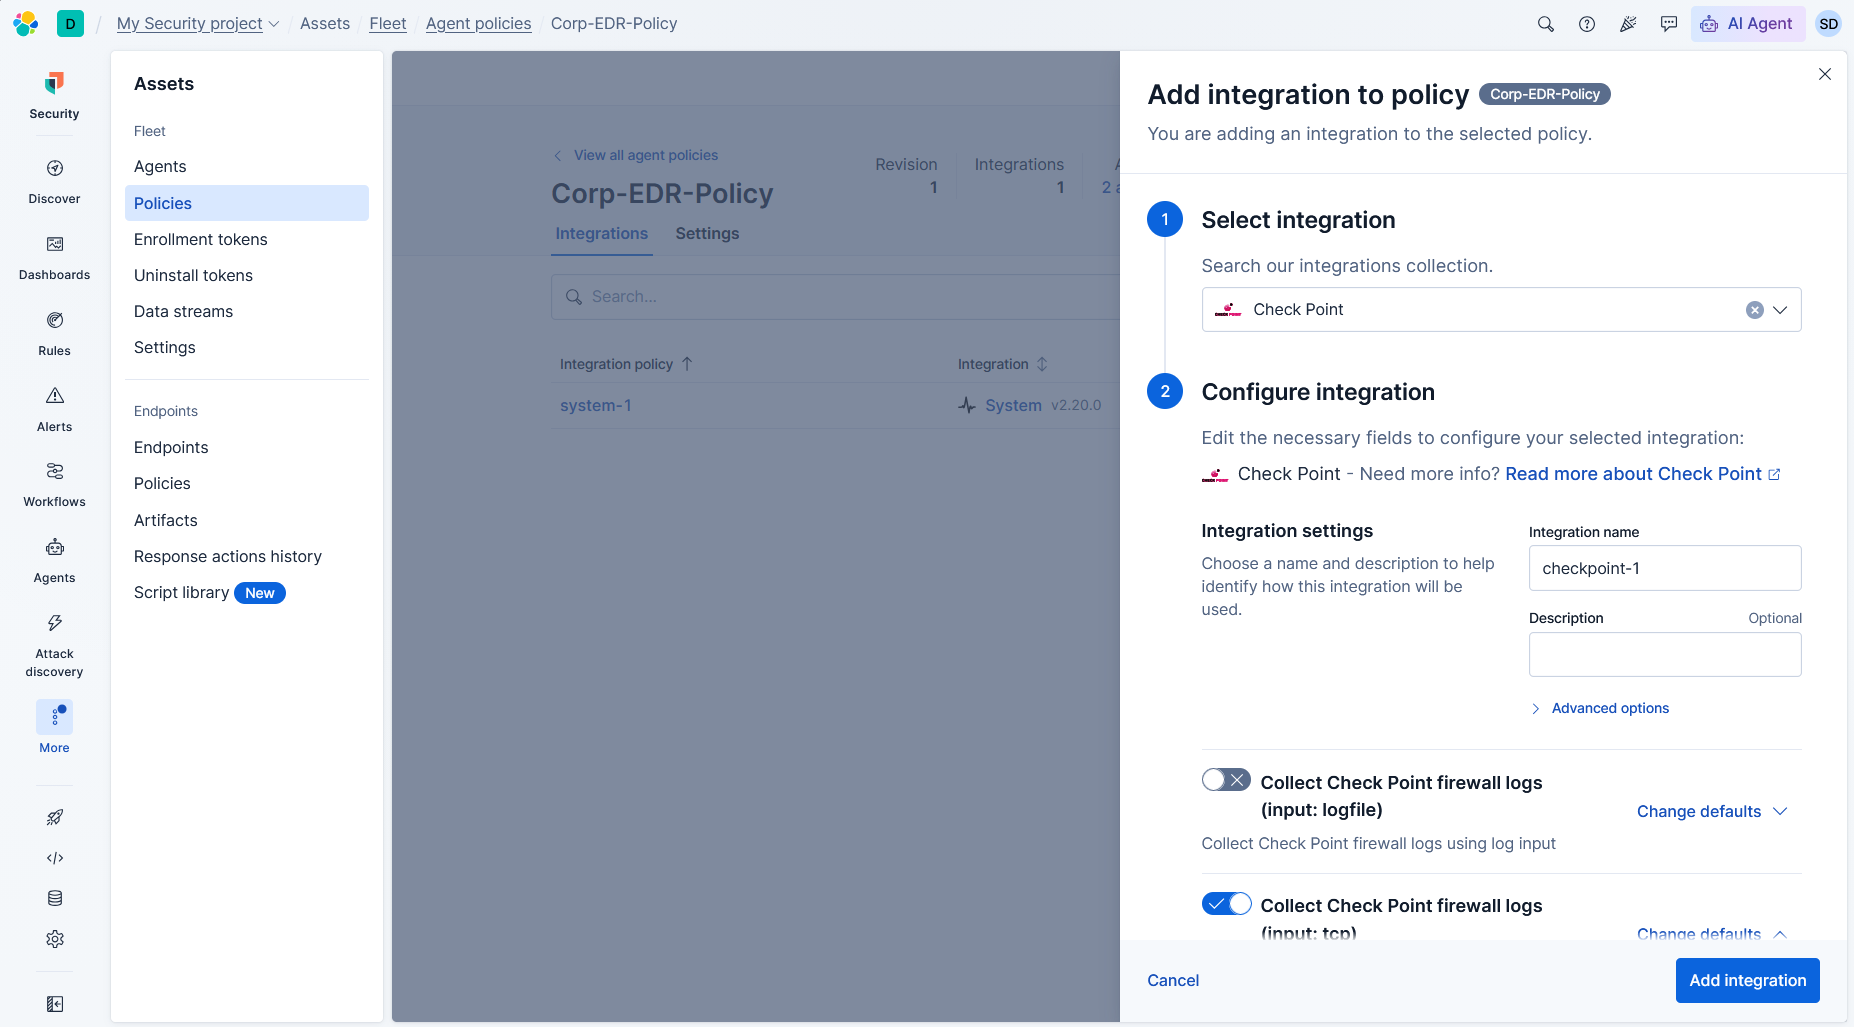
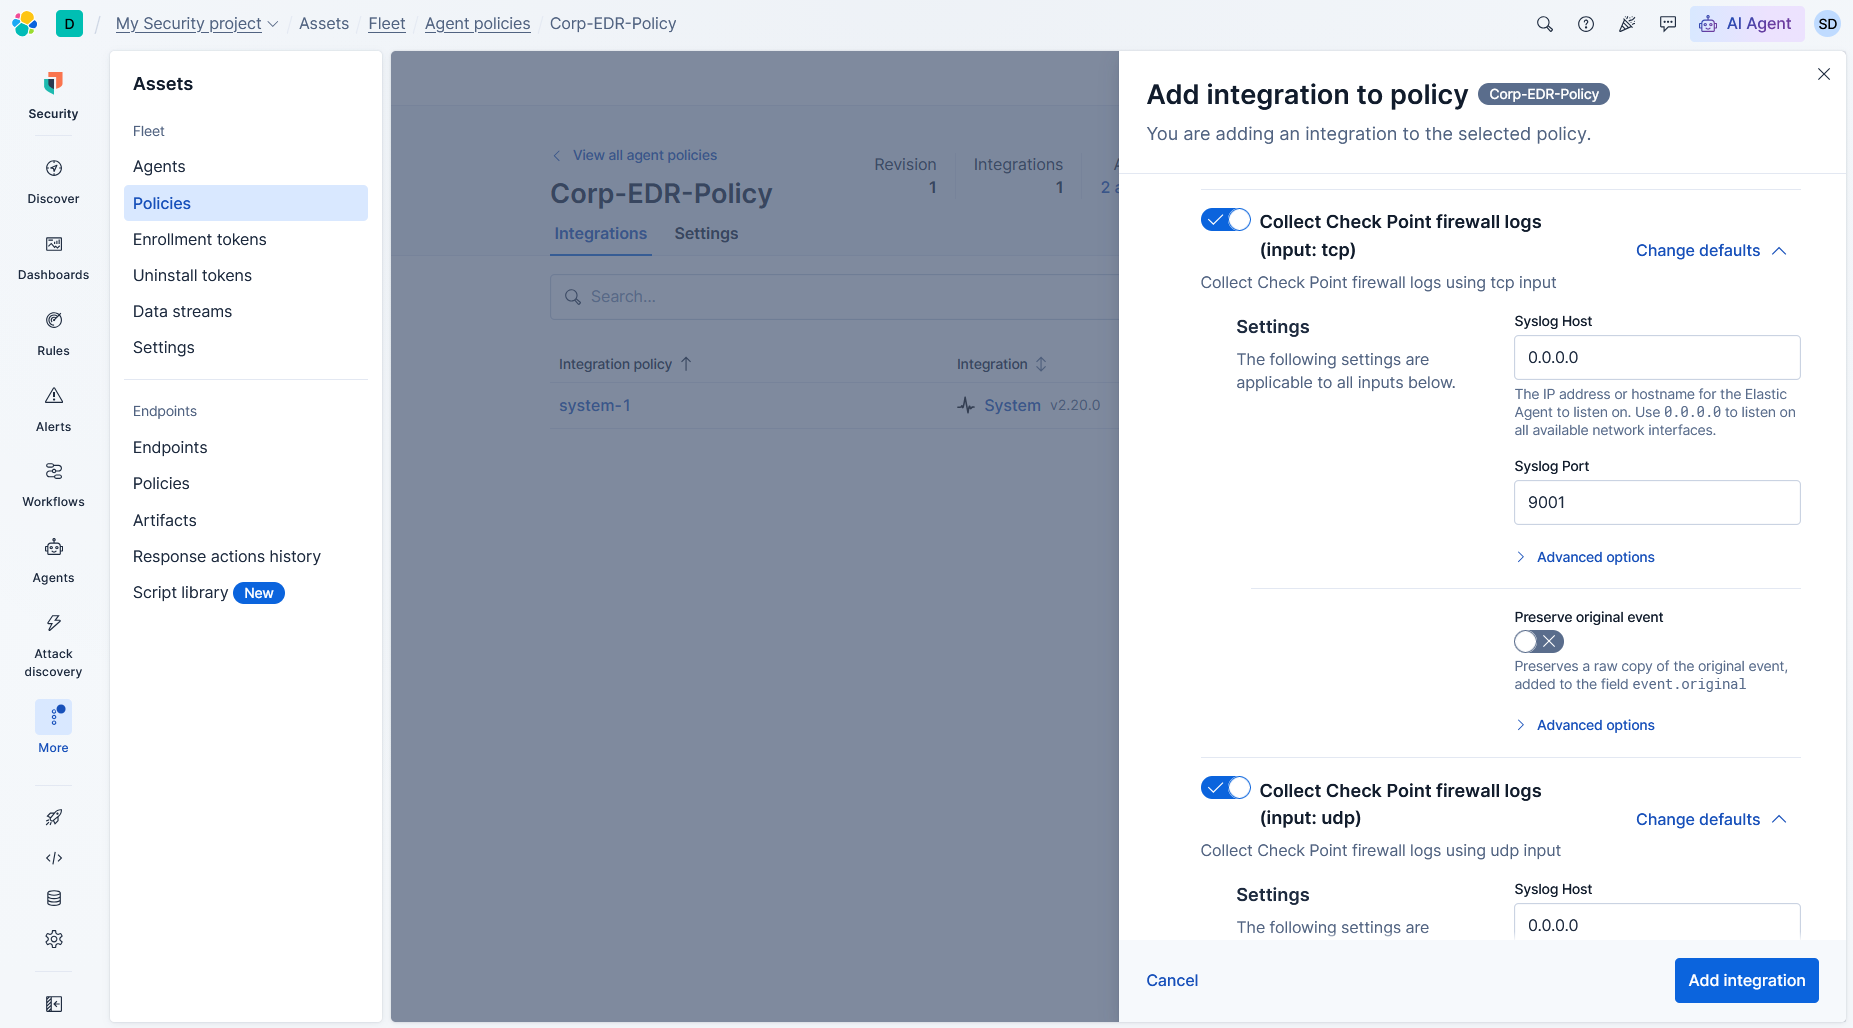
To capture perimeter network traffic without installing agents directly on the firewall, we configure the Check Point integration on Fleet to receive syslog traffic on Syslog Port 9001 (for both TCP and UDP). This turns our Linux gateway endpoint (linux31) into a syslog proxy. The Check Point firewall exports syslog packets directly to this gateway, which aggregates, parses, and forwards the stream to the Elastic platform.
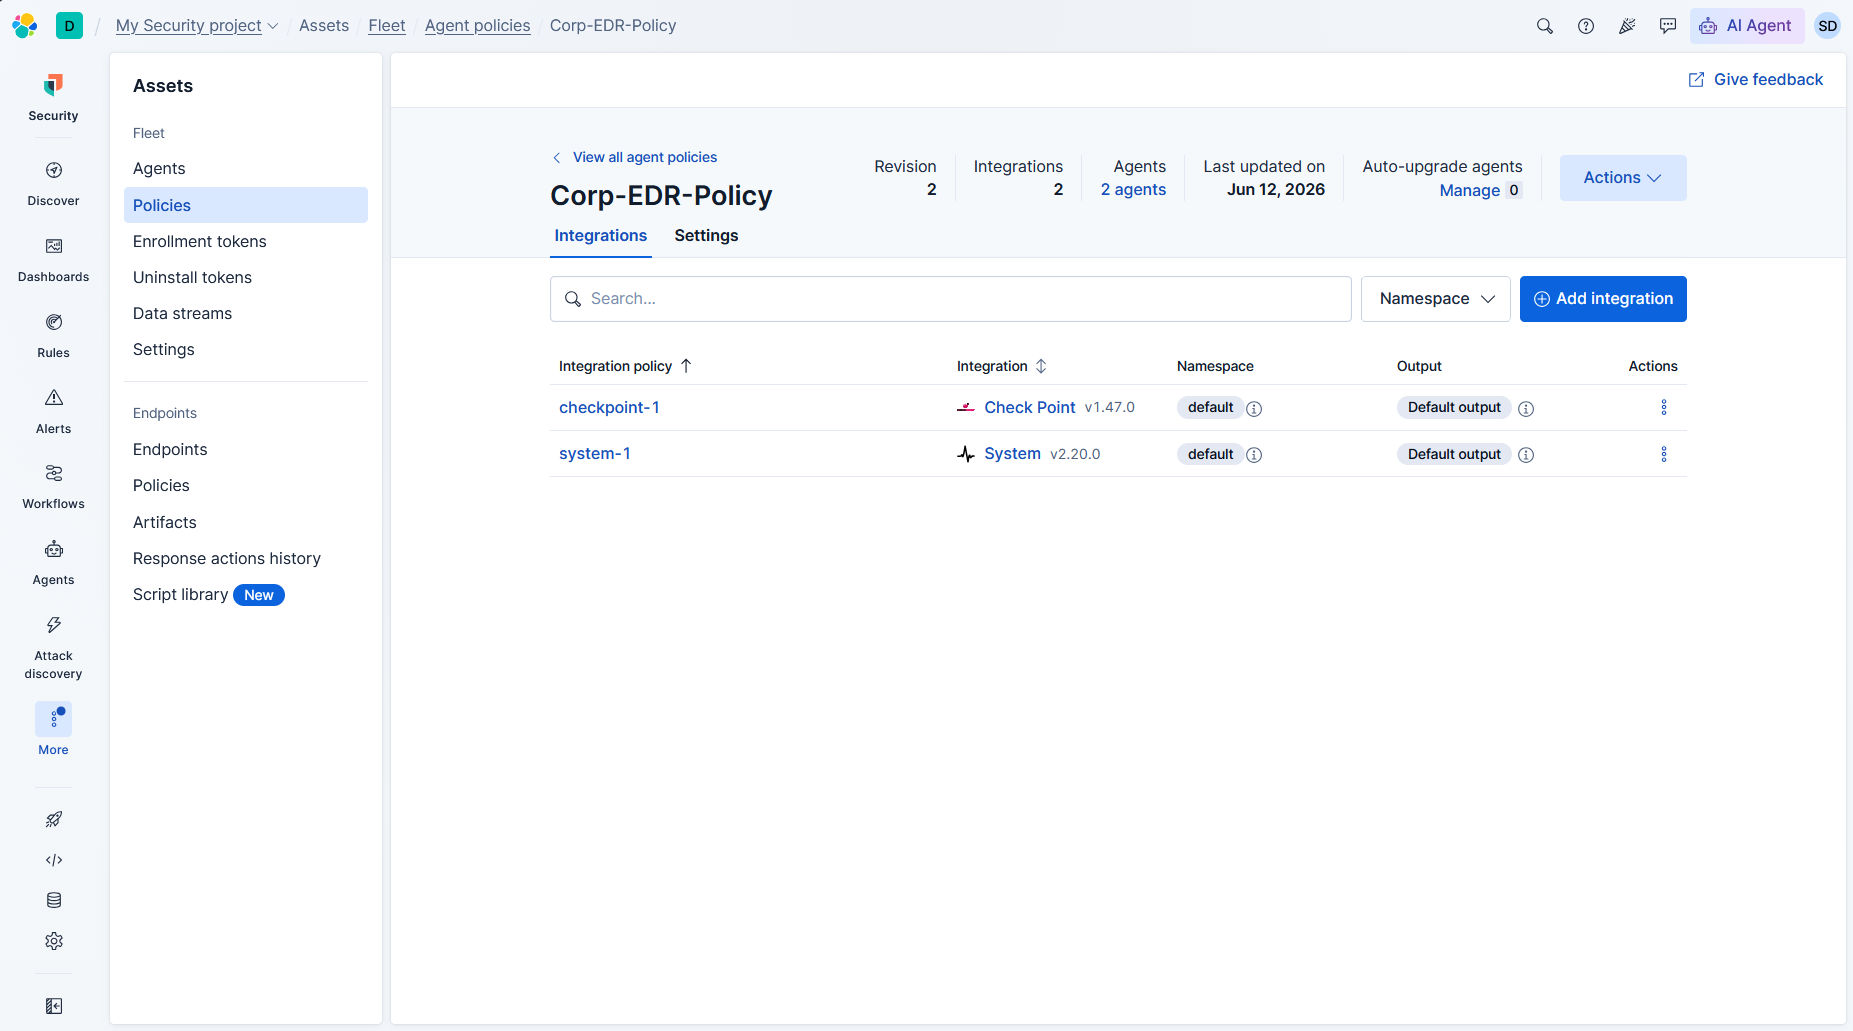
We save and deploy the integration. The Fleet console confirms that the Corp-EDR-Policy now contains system-1 and checkpoint-1 integrations.
To verify that the listener port is active on our Linux gateway host (linux31), we execute ss -tulnp. The output confirms that the Elastic agent daemon (elastic-otel-co) is actively listening on UDP and TCP ports 9001.

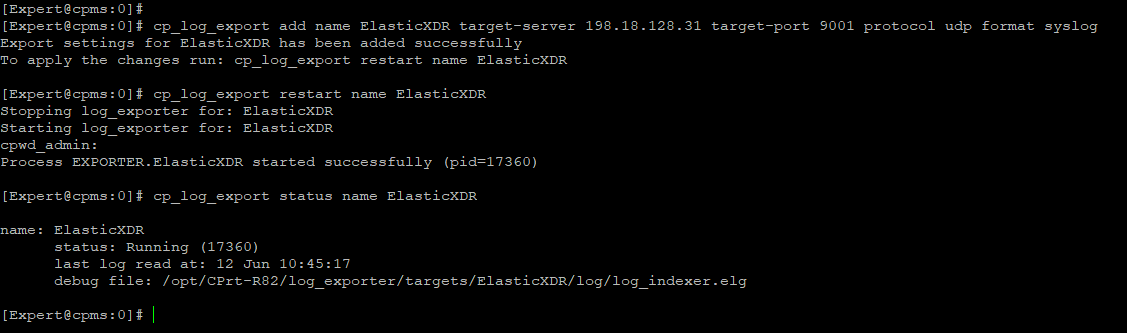
Next, we log into our Check Point Security Management server (cpms) via CLI and configure the Log Exporter. We run cp_log_export add name ElasticXDR target-server 198.18.128.31 target-port 9001 protocol udp format syslog. We restart the service to apply settings and confirm that its status is Running.
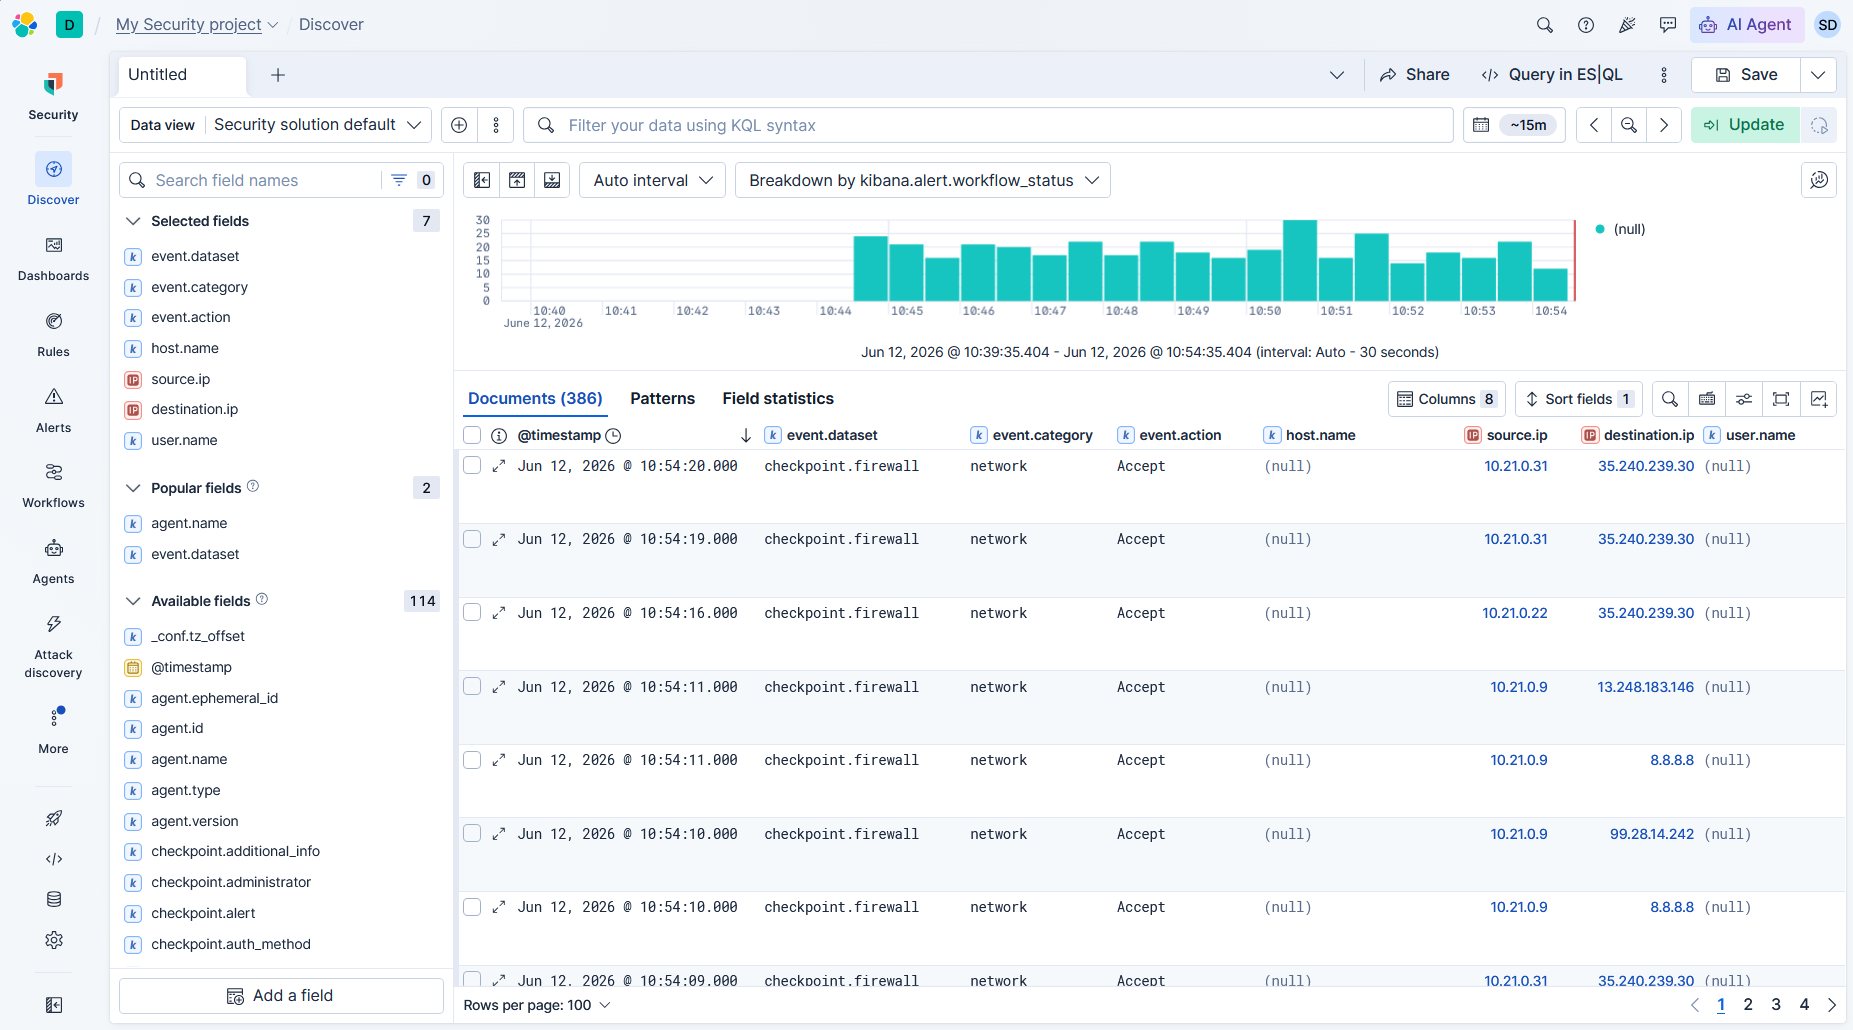
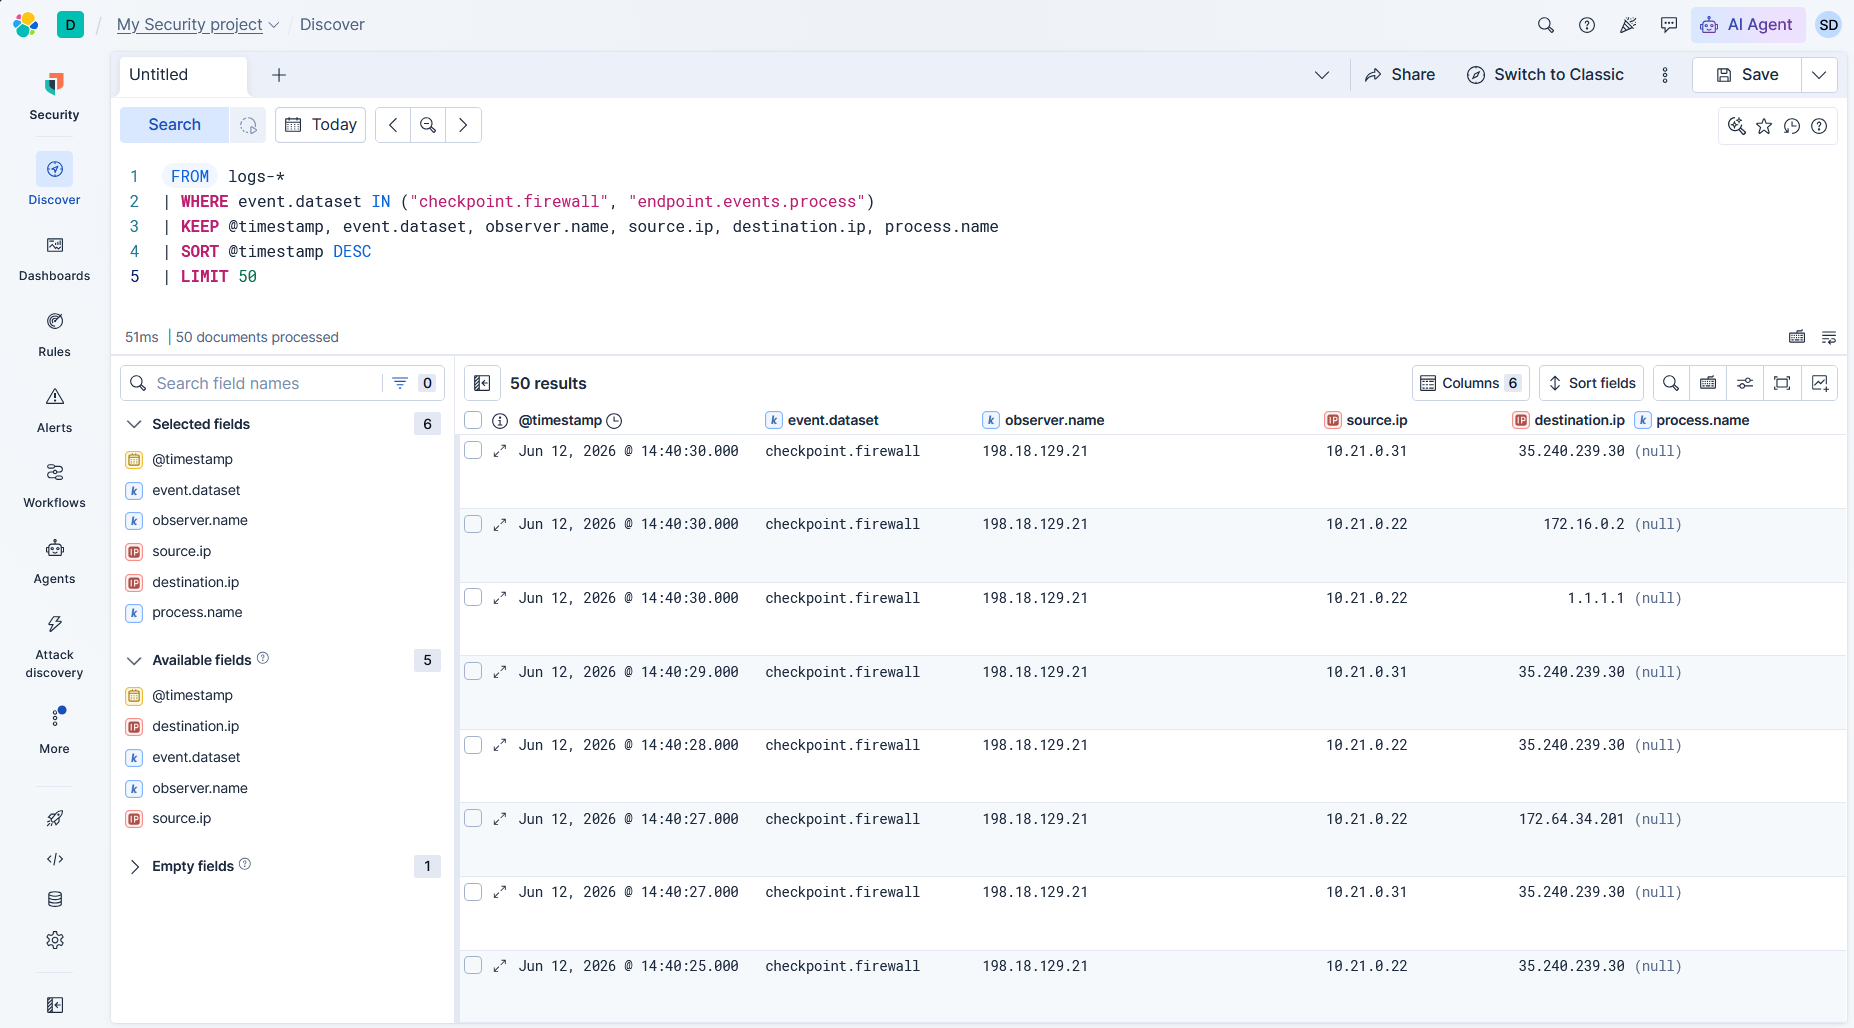
In Elastic Discover, we filter for logs and verify that logs from the Check Point firewall (checkpoint.firewall) are streaming in successfully, showing network traffic being accepted from local sources like 10.21.0.31.
We utilize Elastic’s ES|QL (Elasticsearch Query Language) console to retrieve and correlate logs across datasets. We execute a query targeting firewall and process events:
FROM logs-*
| WHERE event.dataset IN ("checkpoint.firewall", "endpoint.events.process")
| KEEP @timestamp, event.dataset, observer.name, source.ip, destination.ip, process.name
| SORT @timestamp DESC
| LIMIT 50
The query executes successfully, providing a unified chronological feed.
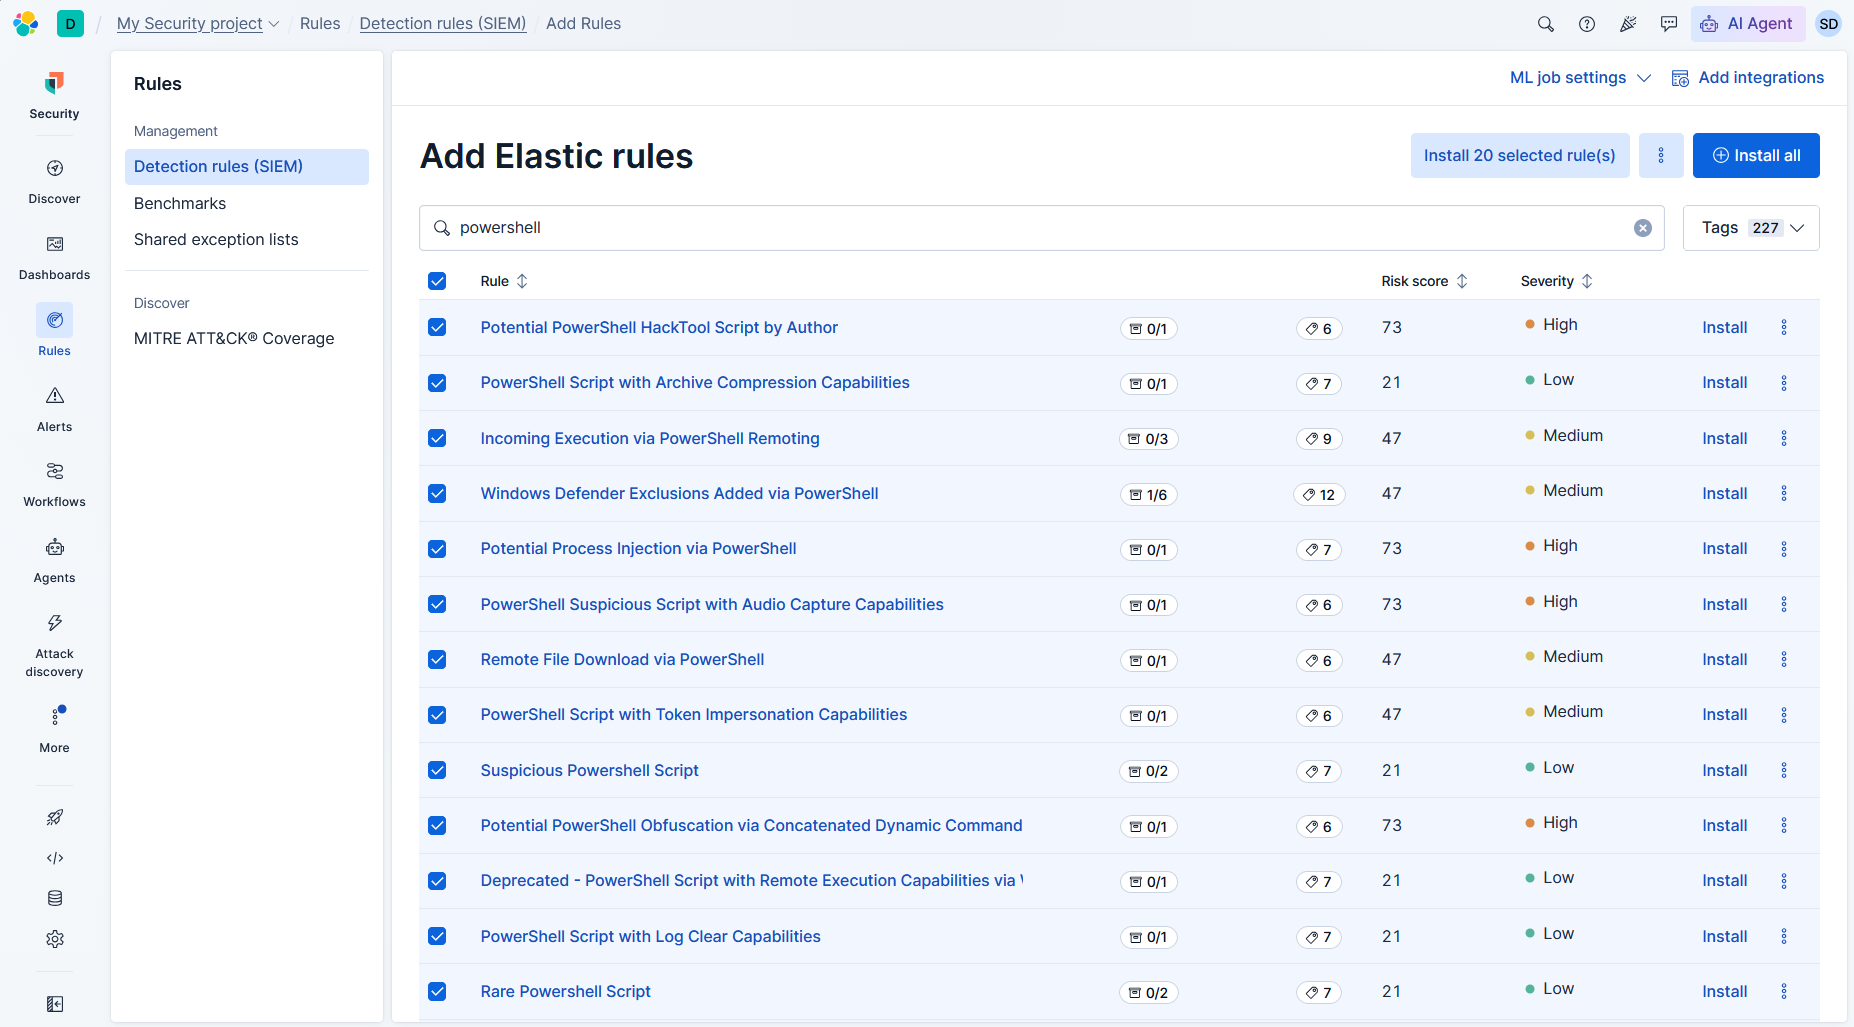
To configure threat detection, we navigate to Rules → Detection rules (SIEM) and install prebuilt Elastic detection rules. We filter the appropriate rules matching and install them.
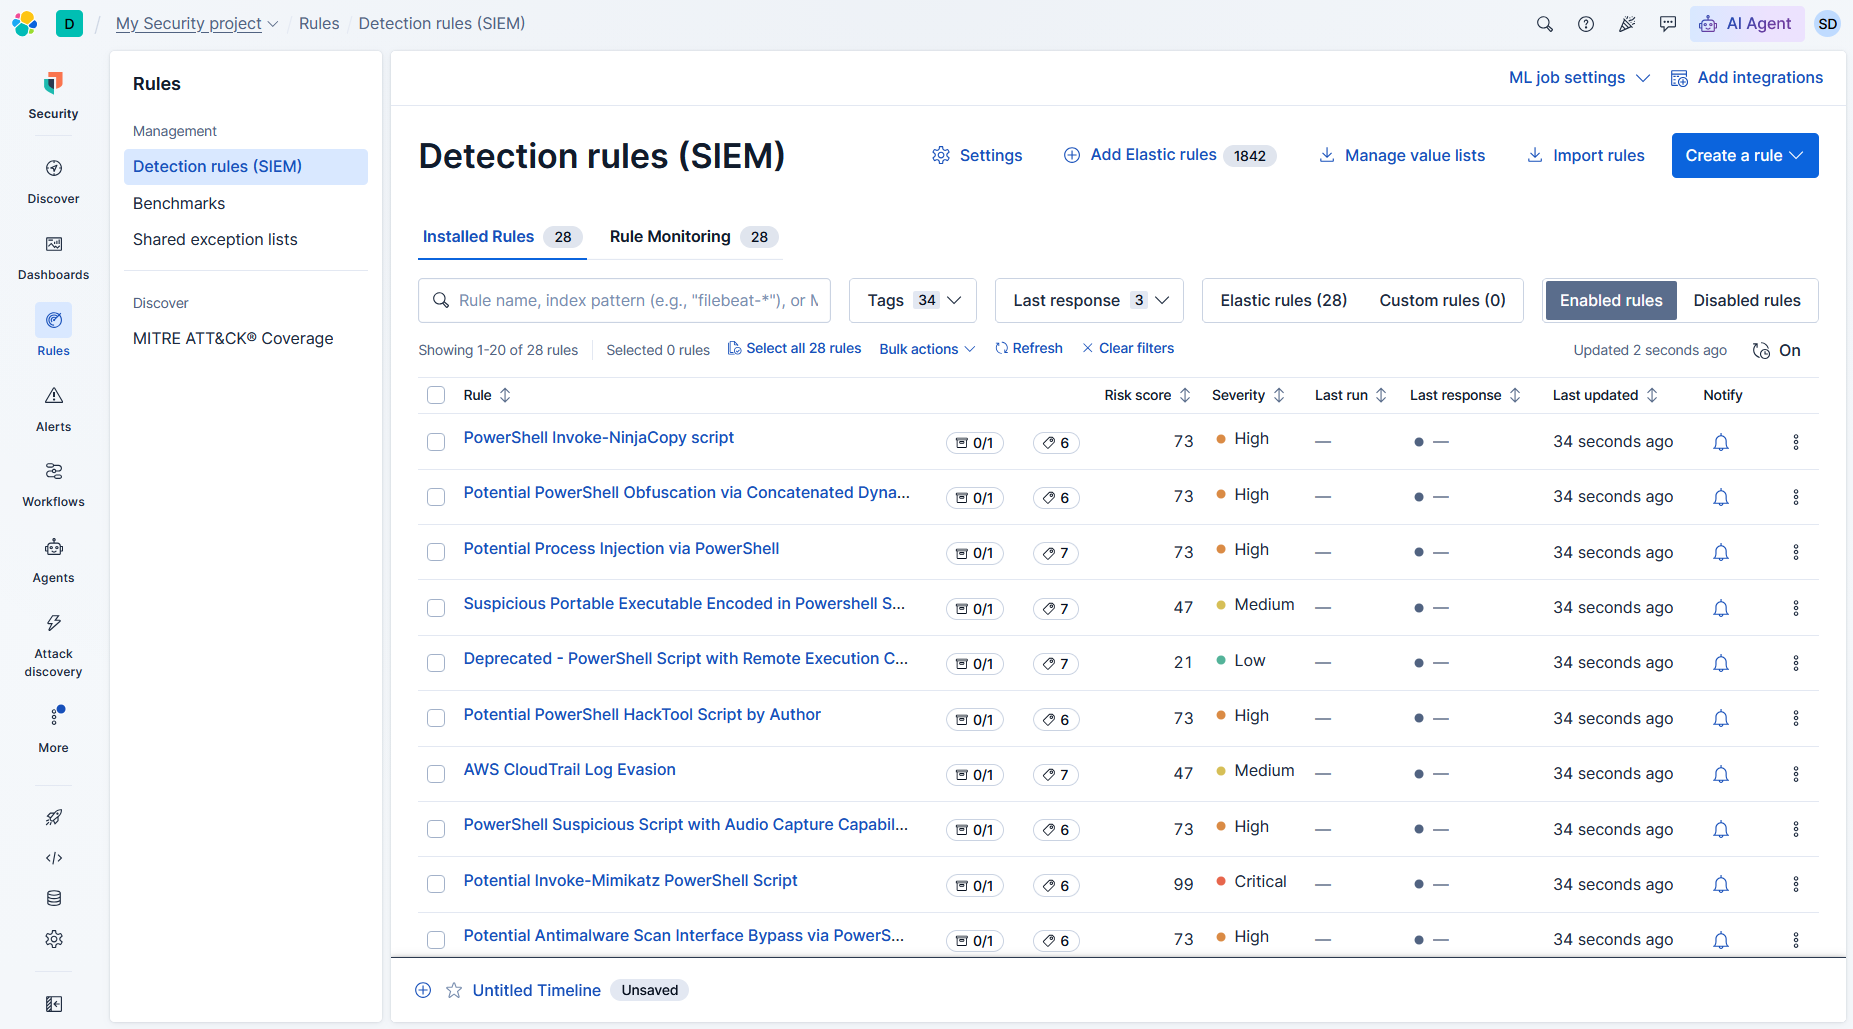
We enable the installed rules (including process injection, obfuscation, and antimalware bypass rules) to monitor incoming logs in real-time.
Living-off-the-Land (LotL) Simulated Attack
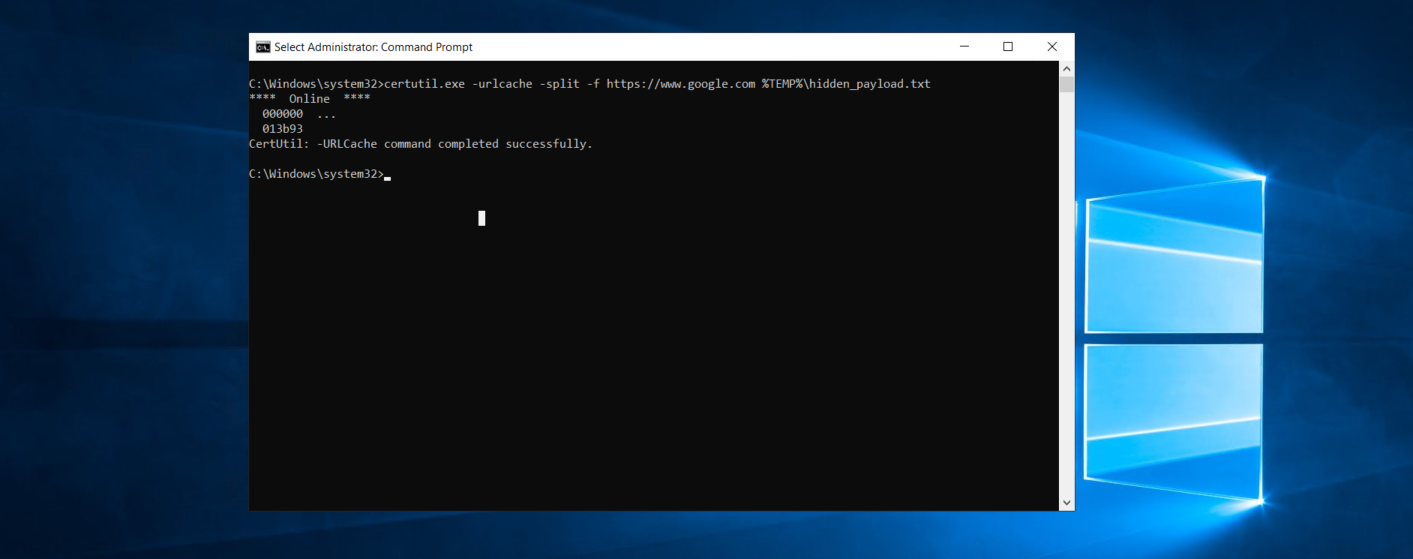
We simulate an adversary using stealthy native tools to bypass local security controls (Living-off-the-Land). On our target Windows host (WIN-22), we open Command Prompt and run the following command to download remote content using a trusted native binary:
certutil.exe -urlcache -split -f https://www.google.com %TEMP%\hidden_payload.txt
The download completes successfully.
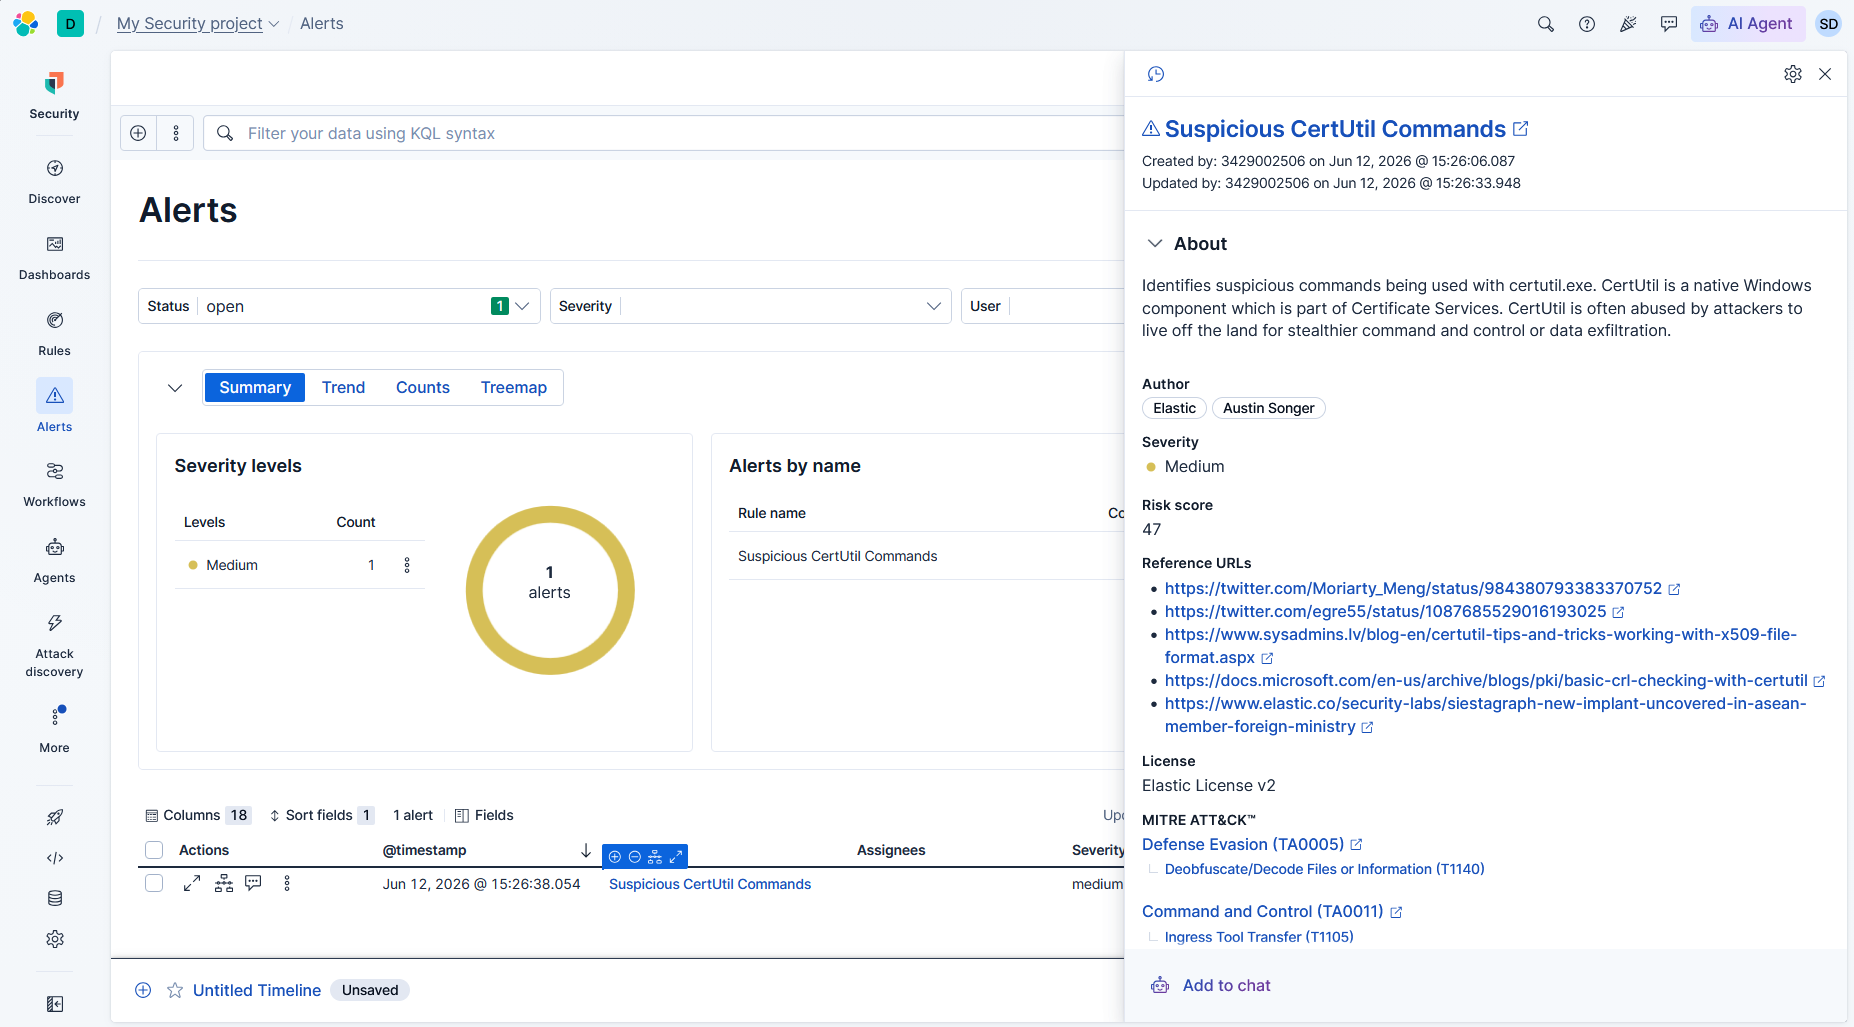
In the Security Alerts dashboard, Elastic immediately registers a medium-severity alert: Suspicious CertUtil Commands. The alert highlights the abuse of the legitimate Certificate Services utility to exfiltrate data or retrieve payload files.
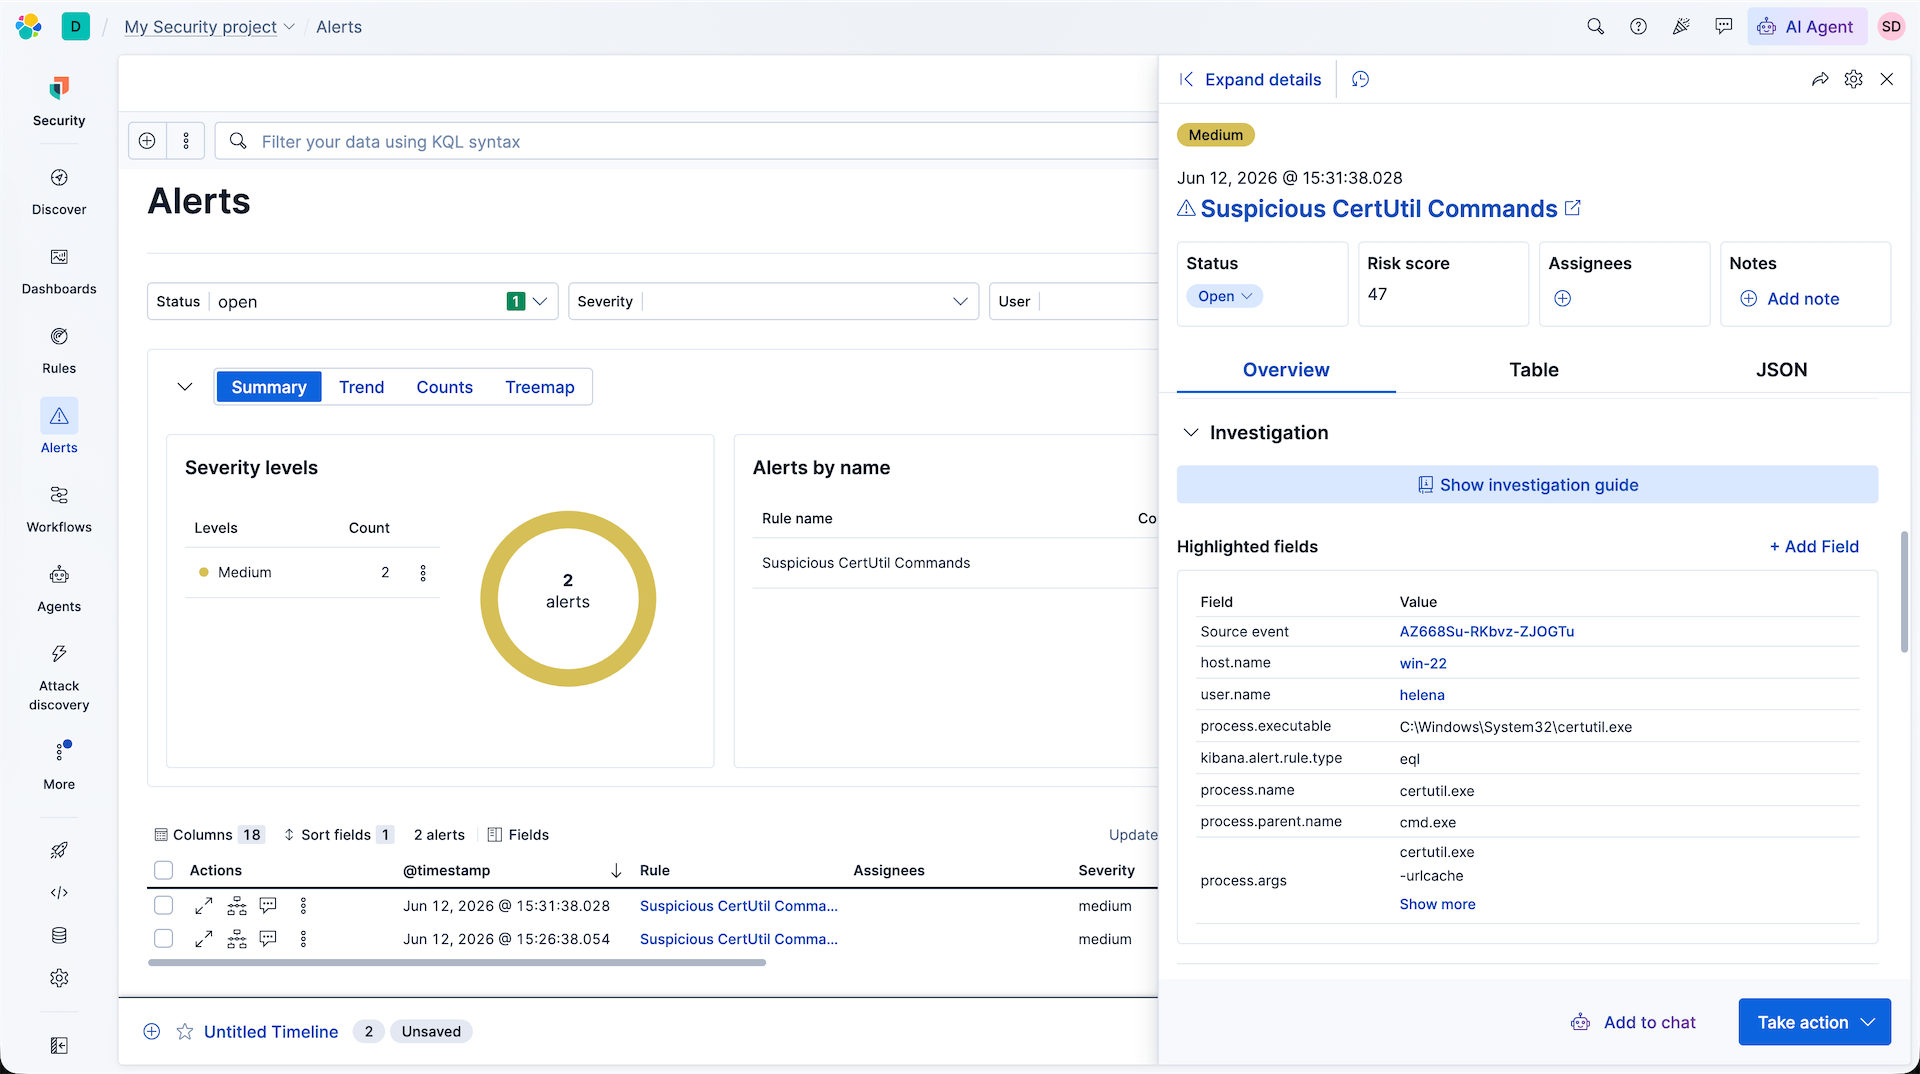
We expand the alert details. Elastic highlights the target host (win-22), user (helena), process executable path (certutil.exe), and parent process name (cmd.exe).
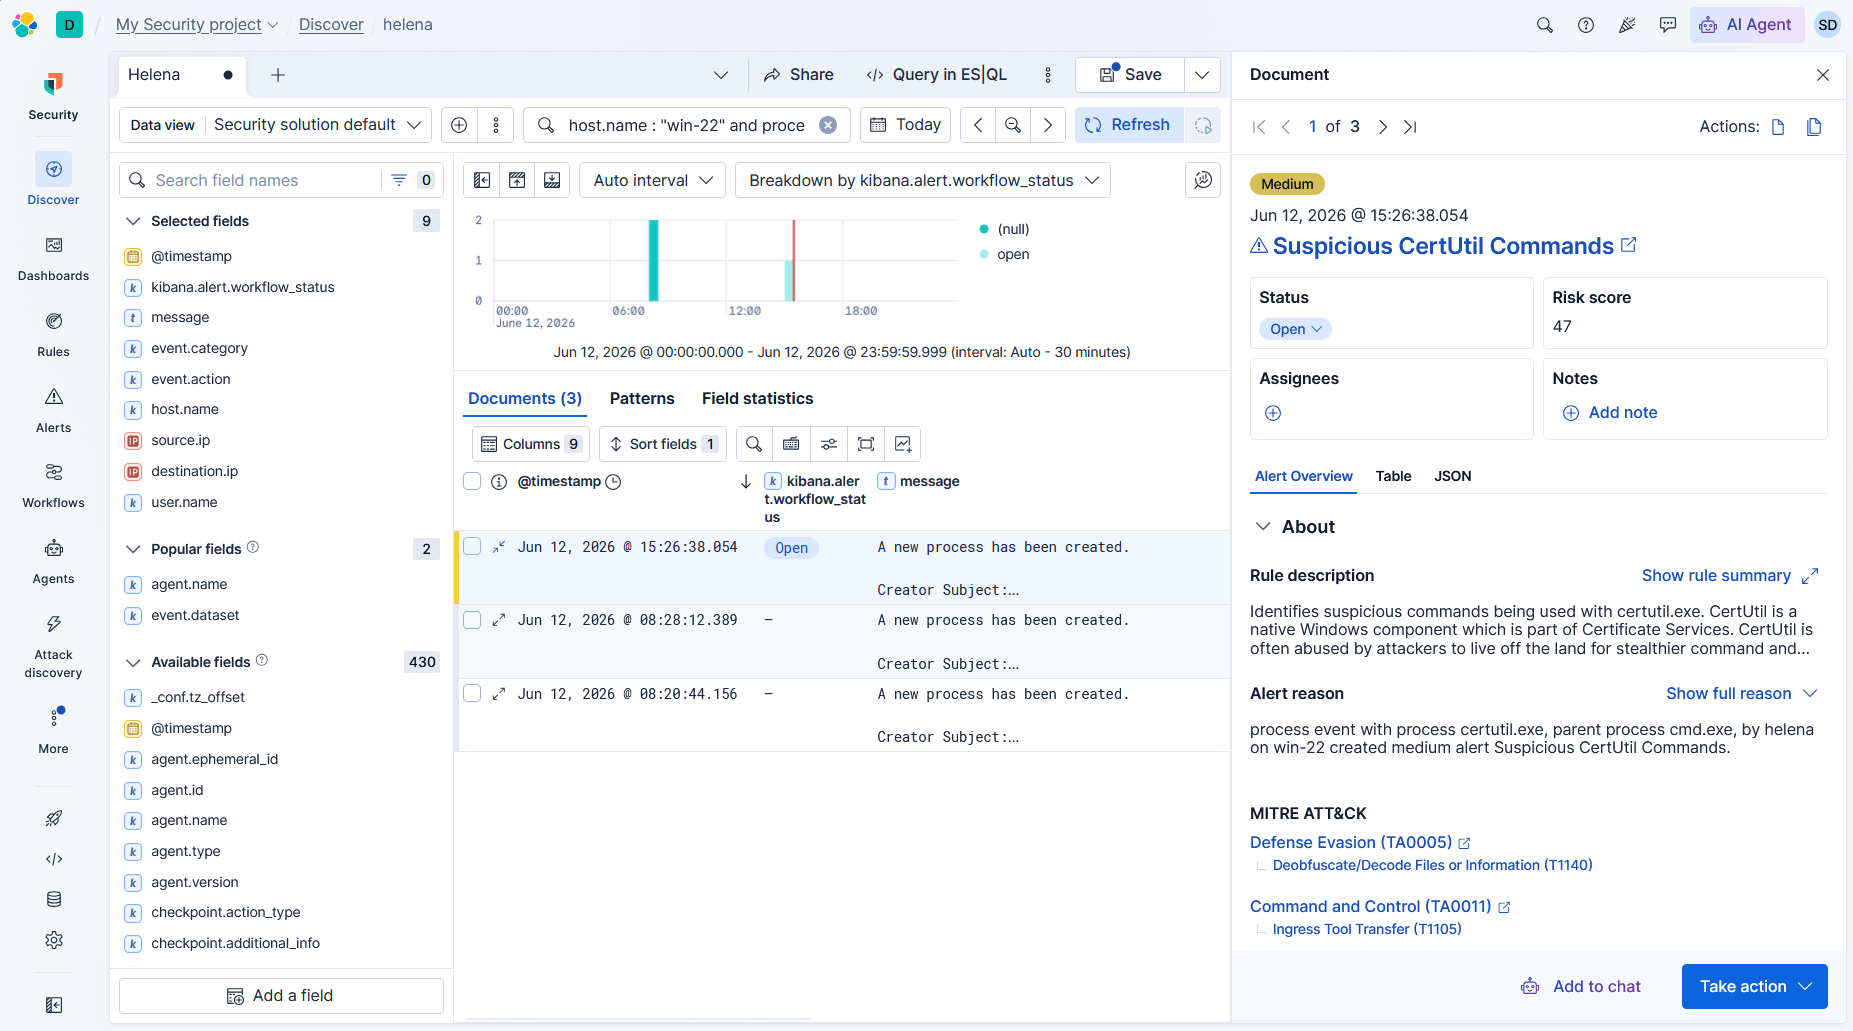
In Discover, we filter for process logs on win-22 to trace the process creation events matching the time window of the certutil abuse.
Active Endpoint Protection (Elastic Defend NGAV)
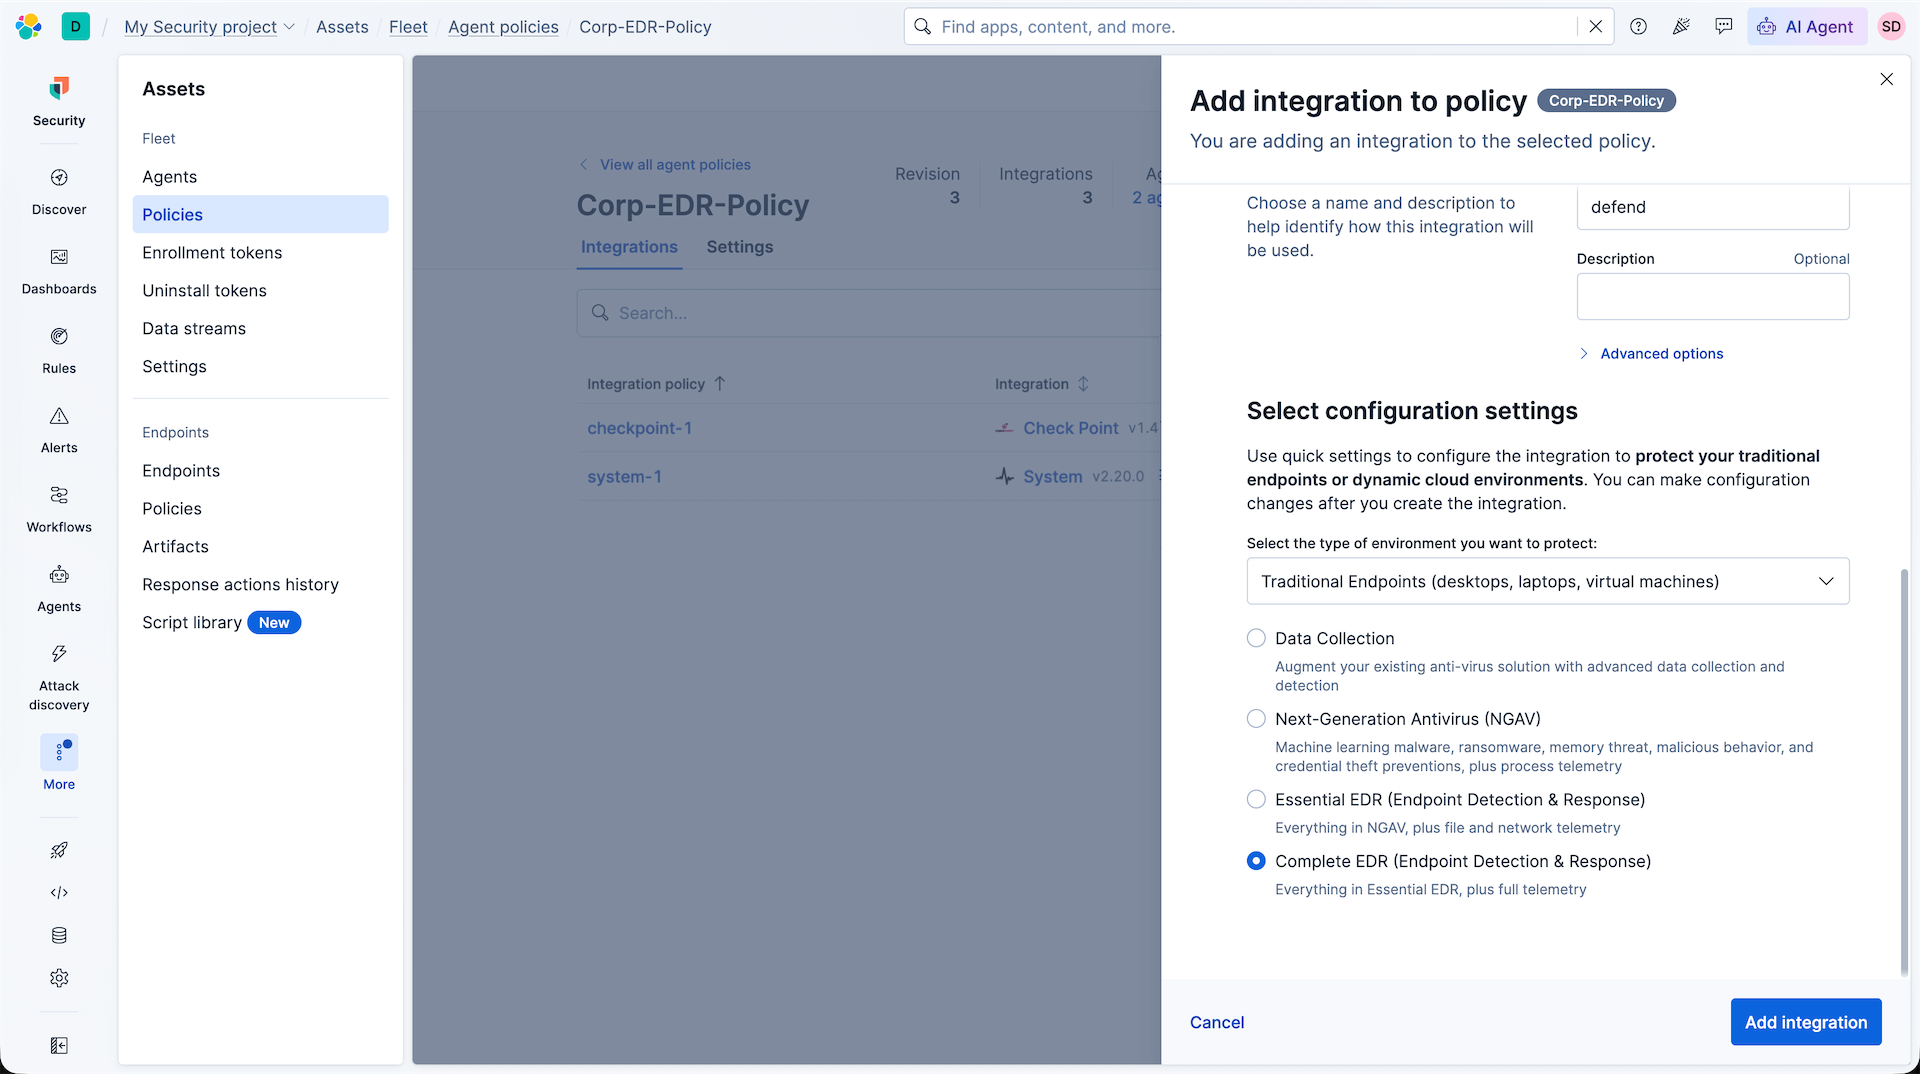
To block execution before it causes damage, we enable Endpoint Protection. We edit our Fleet policy Corp-EDR-Policy and add the Elastic Defend integration.
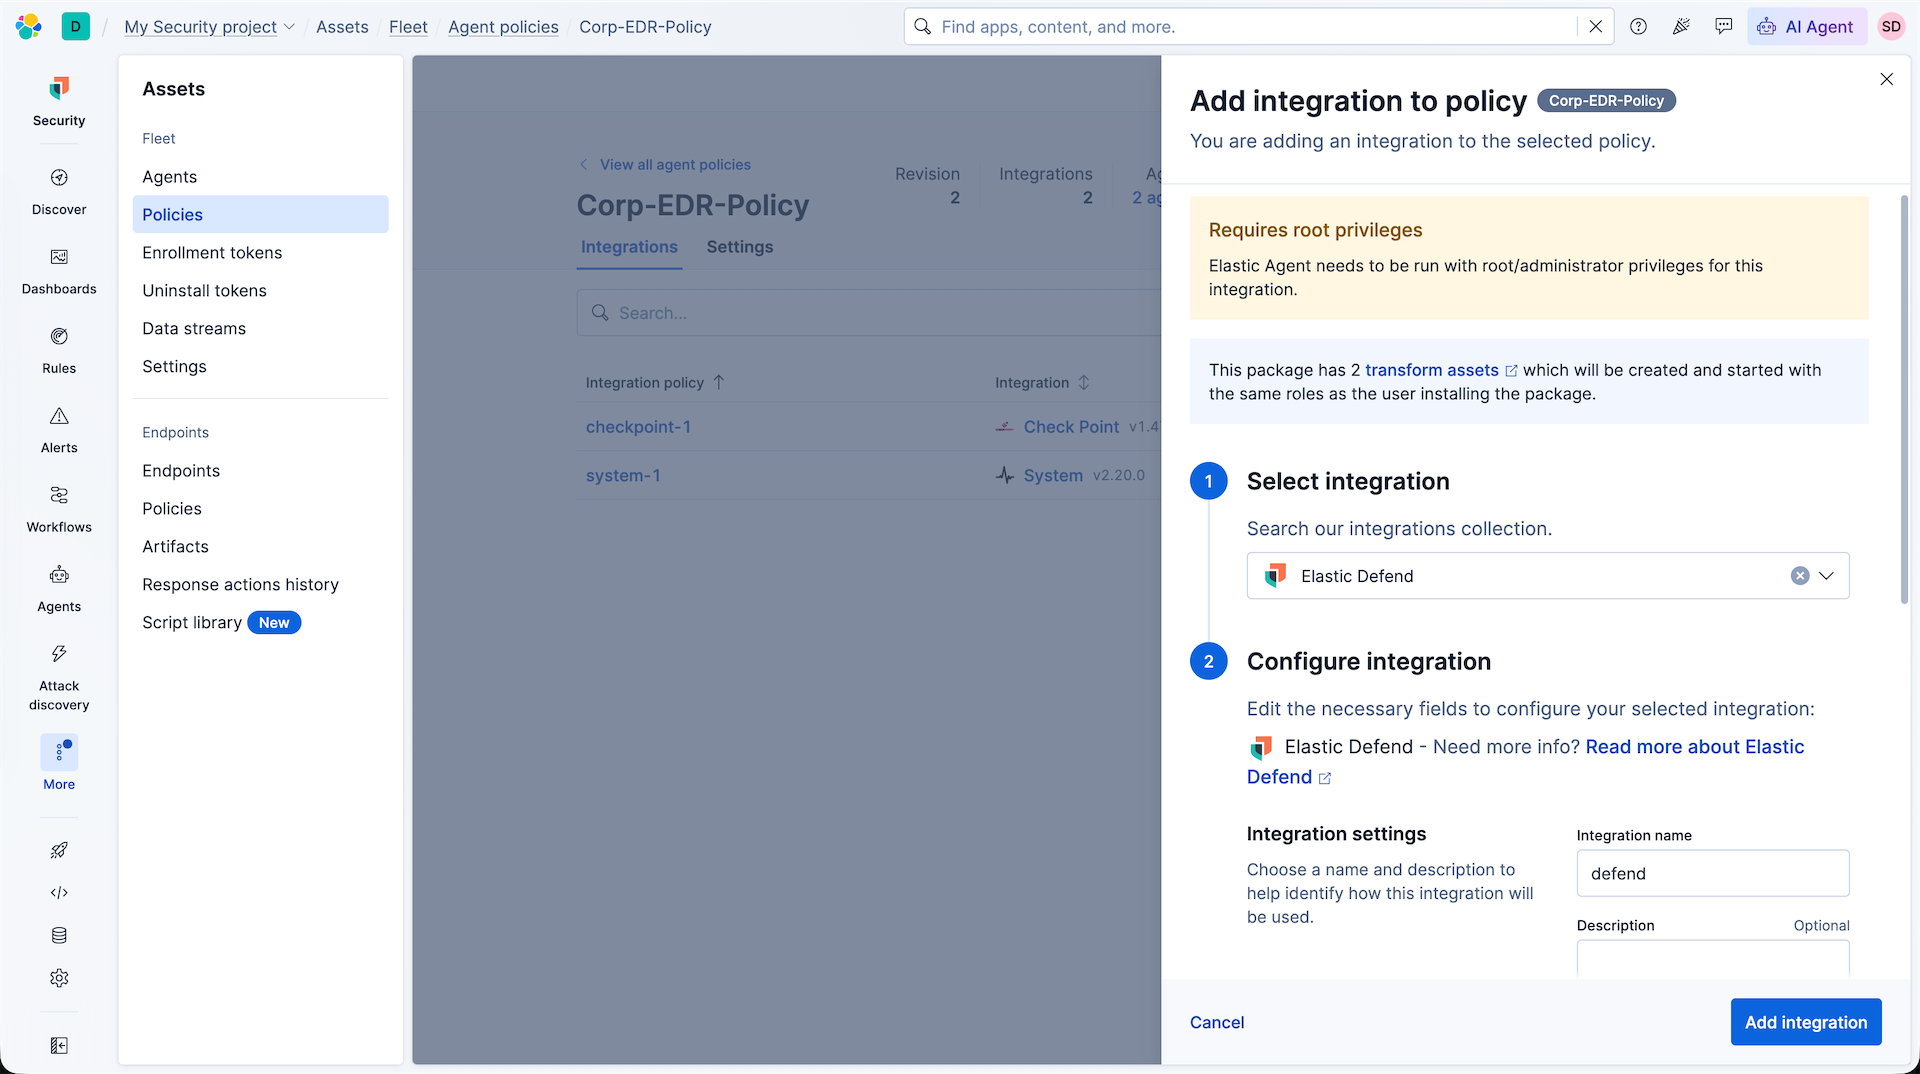
We configure Elastic Defend for Traditional Endpoints and select Complete EDR (Endpoint Detection & Response) to enforce Next-Generation Antivirus (NGAV) prevention and capture file, process, and network telemetry.
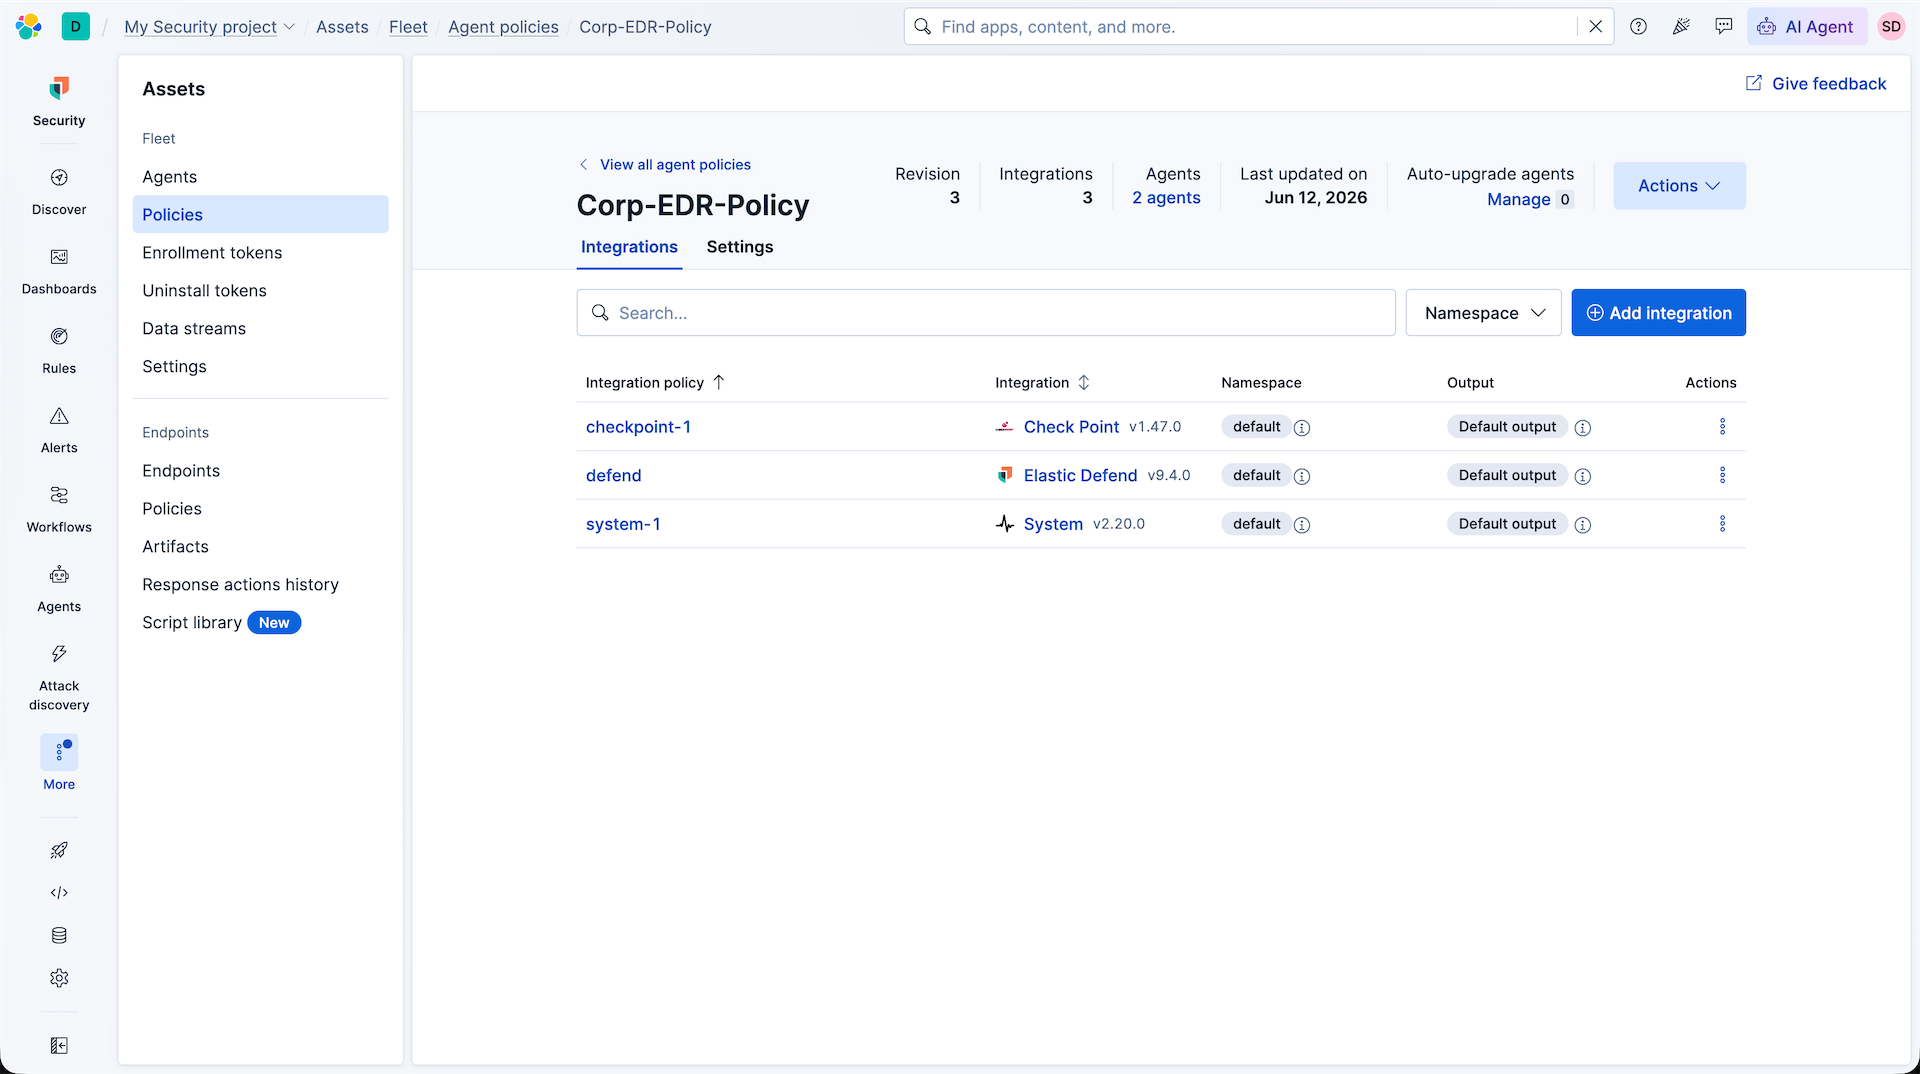
Once saved, the Fleet console displays our policy configured with Check Point logs, Elastic Defend, and System integrations.
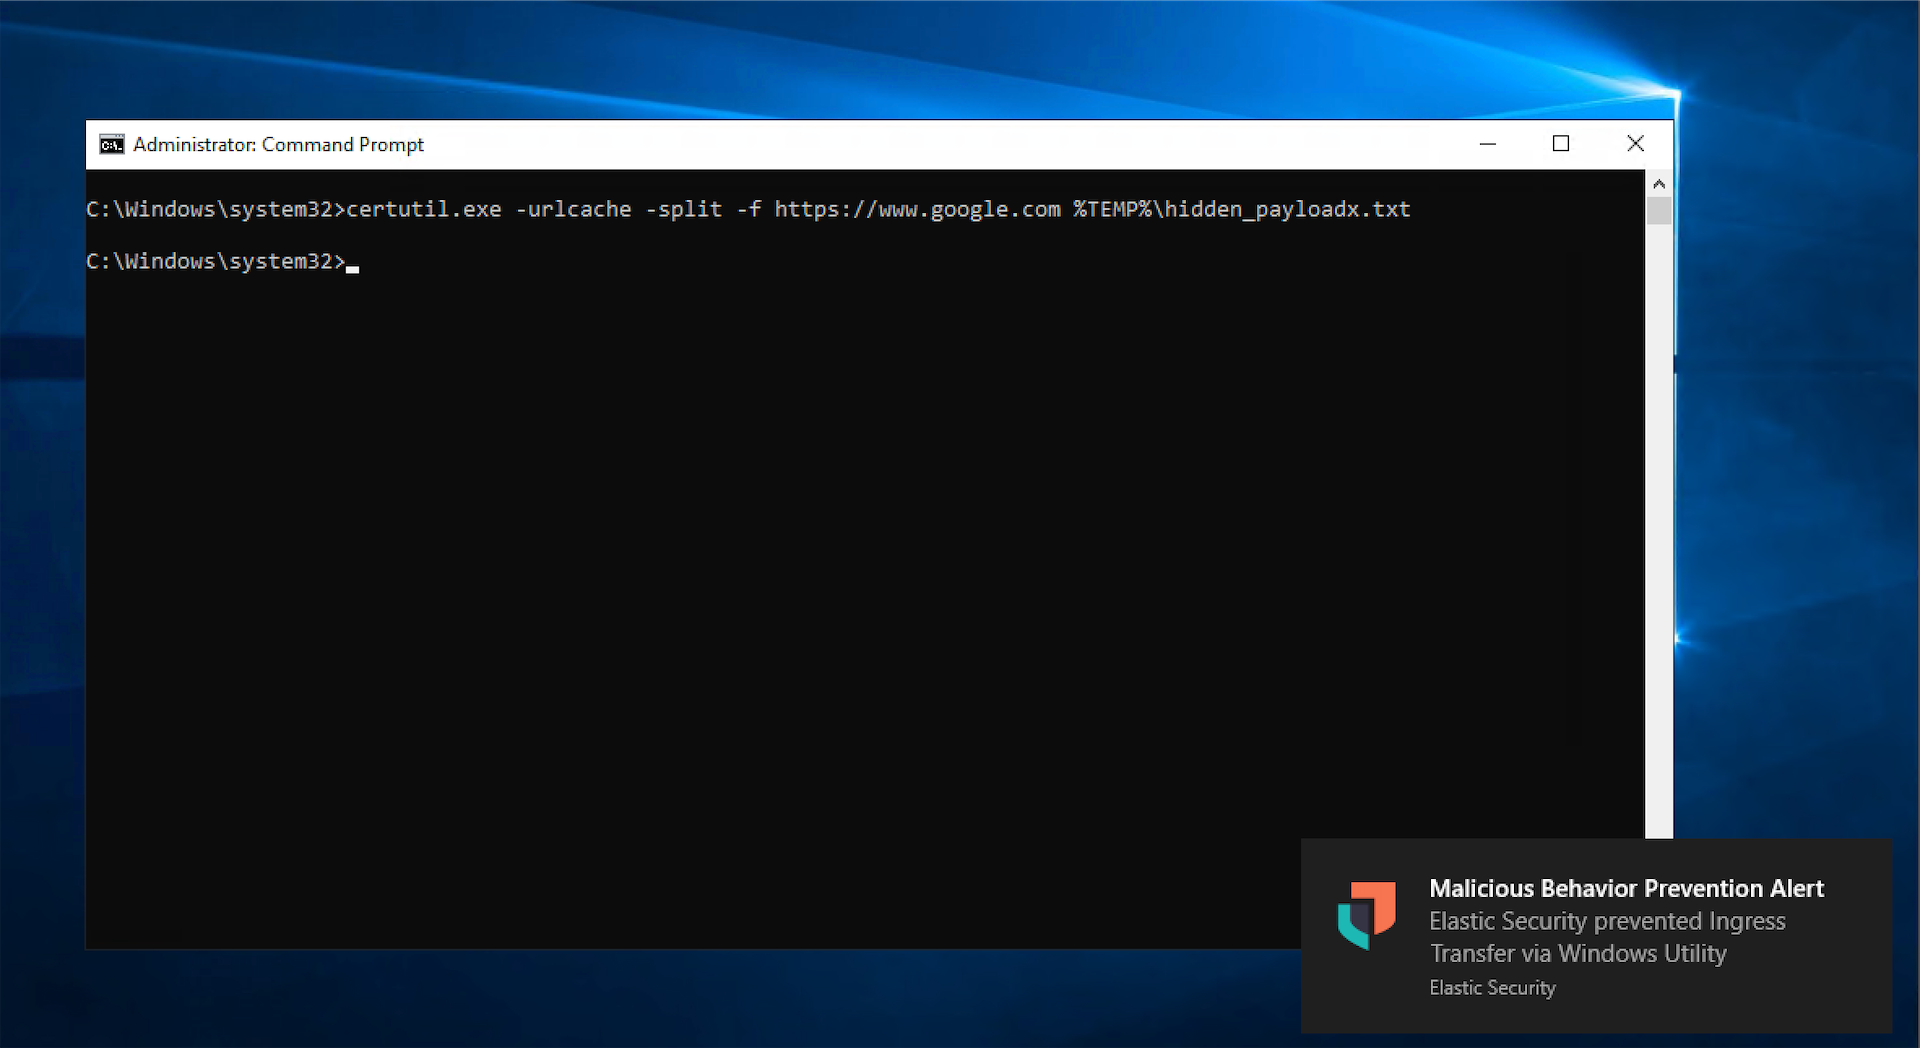
We attempt to simulate the attack again by running a similar download command:
certutil.exe -urlcache -split -f https://www.google.com %TEMP%\hidden_payloadx.txt
This time, the download is immediately terminated, and an Elastic Security system notification pops up warning that malicious behavior has been prevented.
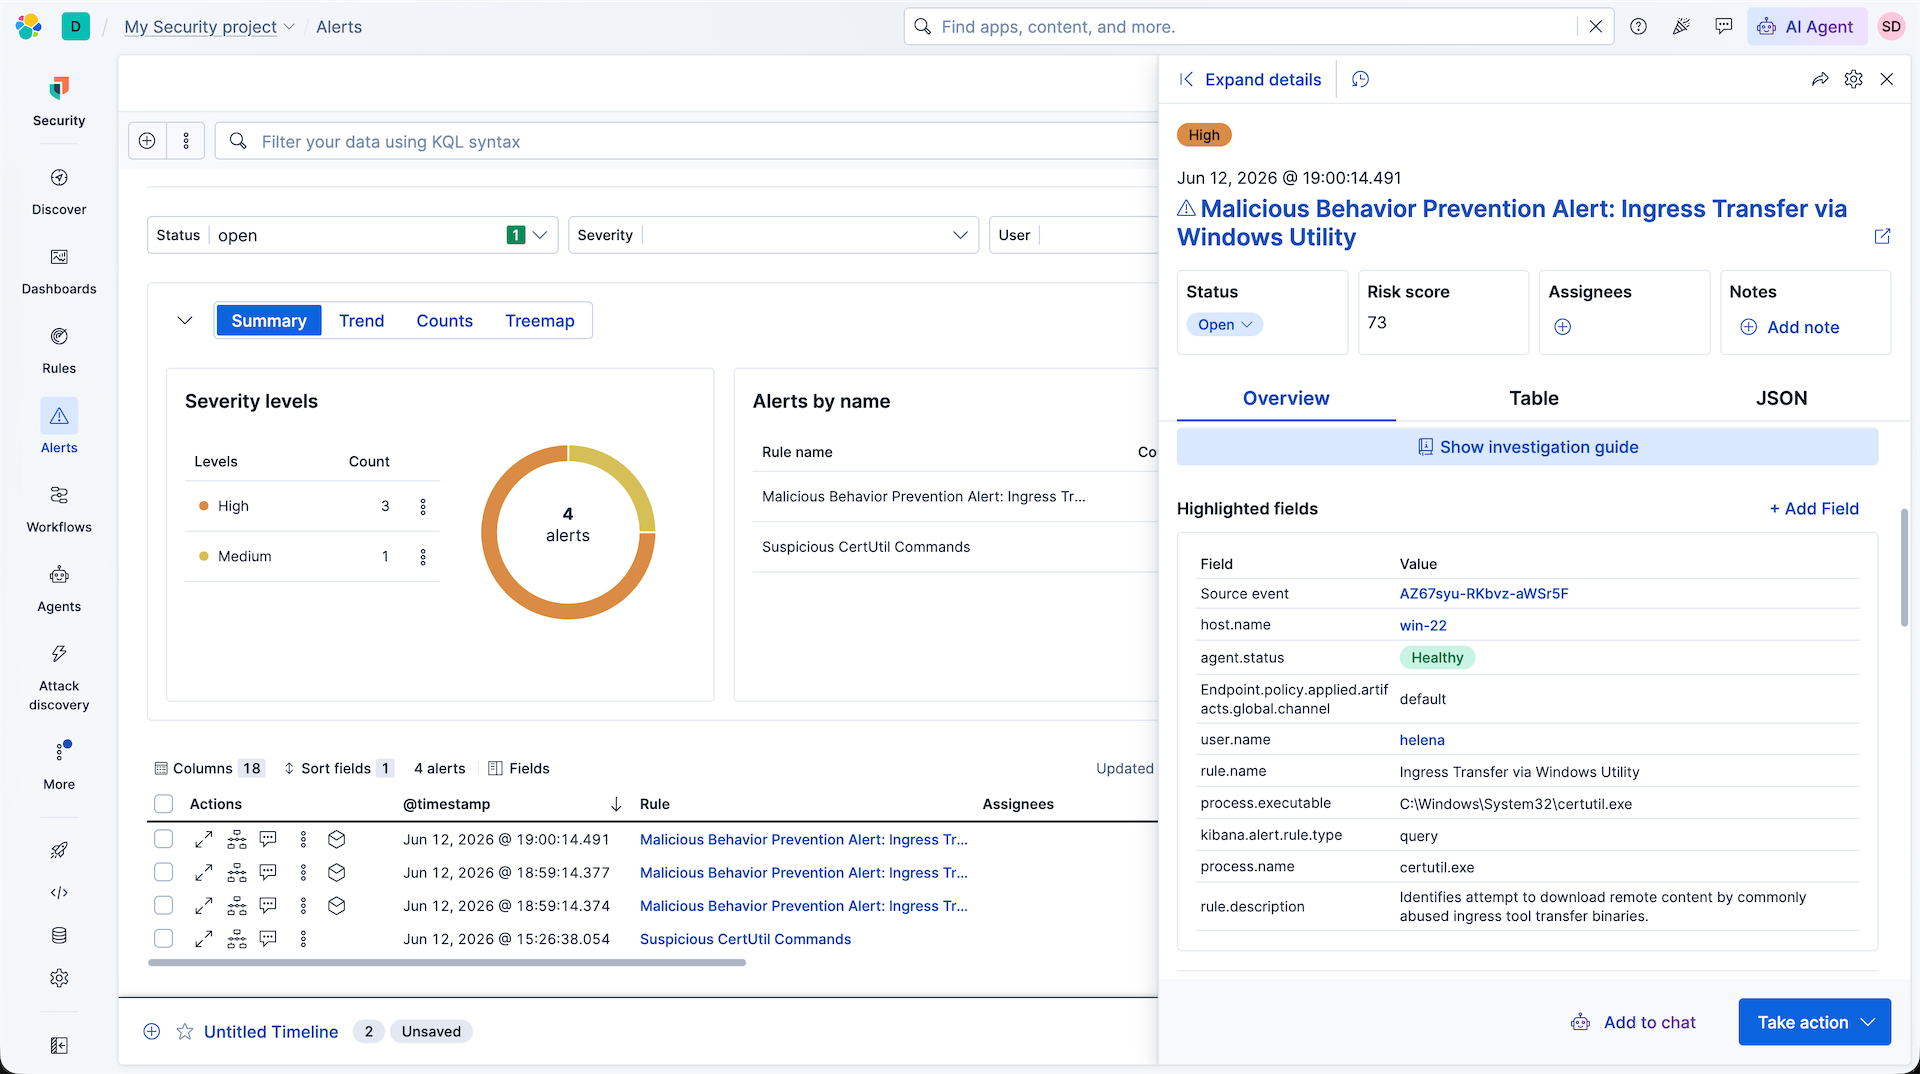
We check the Alerts page. Elastic logs a high-severity alert: Malicious Behavior Prevention Alert: Ingress Transfer via Windows Utility.
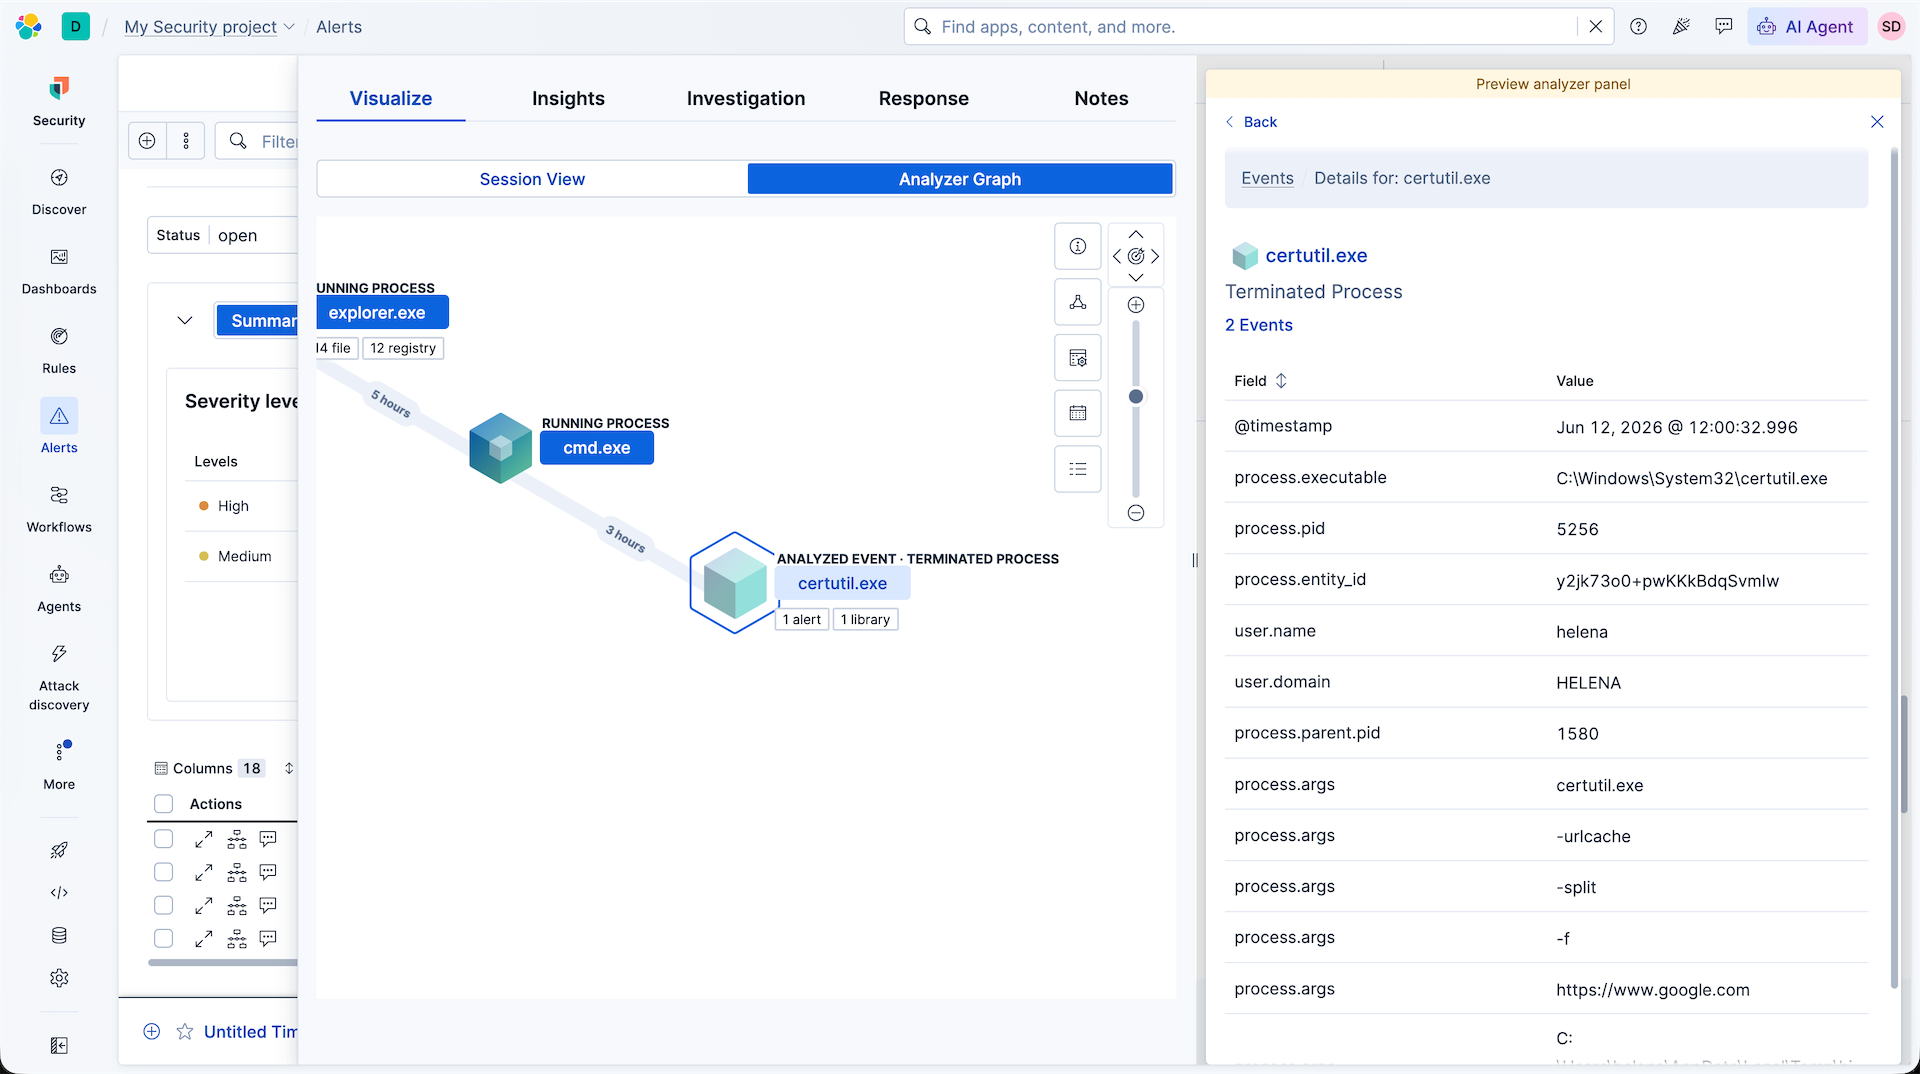
To map the parent-child relationships visually, we load the interactive process tree (Analyzer Graph). The flowchart tracks the execution chain: explorer.exe ➔ cmd.exe ➔ certutil.exe (flagged as a Terminated Process). We inspect the specific arguments containing the split URL and download flags.
Incident Response & Host Containment
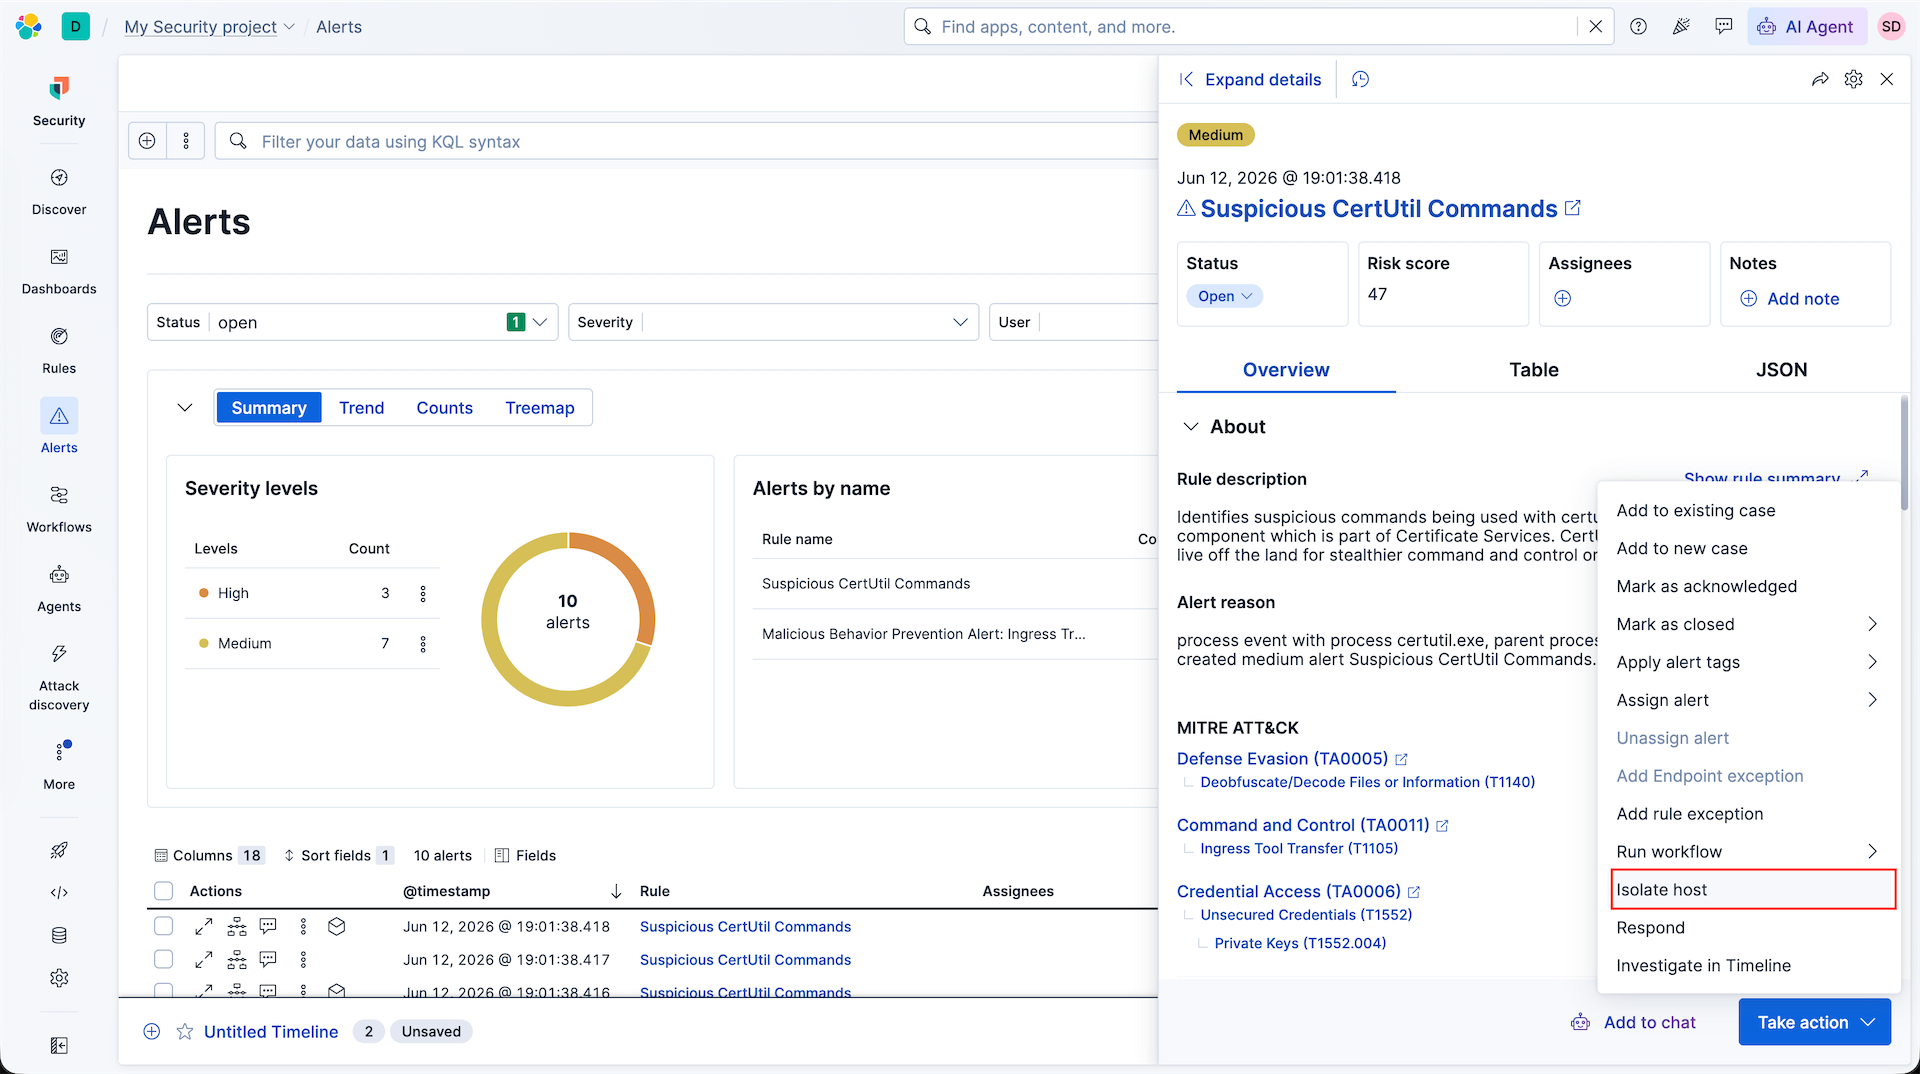
To prevent lateral movement during active compromises, we test host containment. On the alert details page, we open the actions menu and select Isolate host.
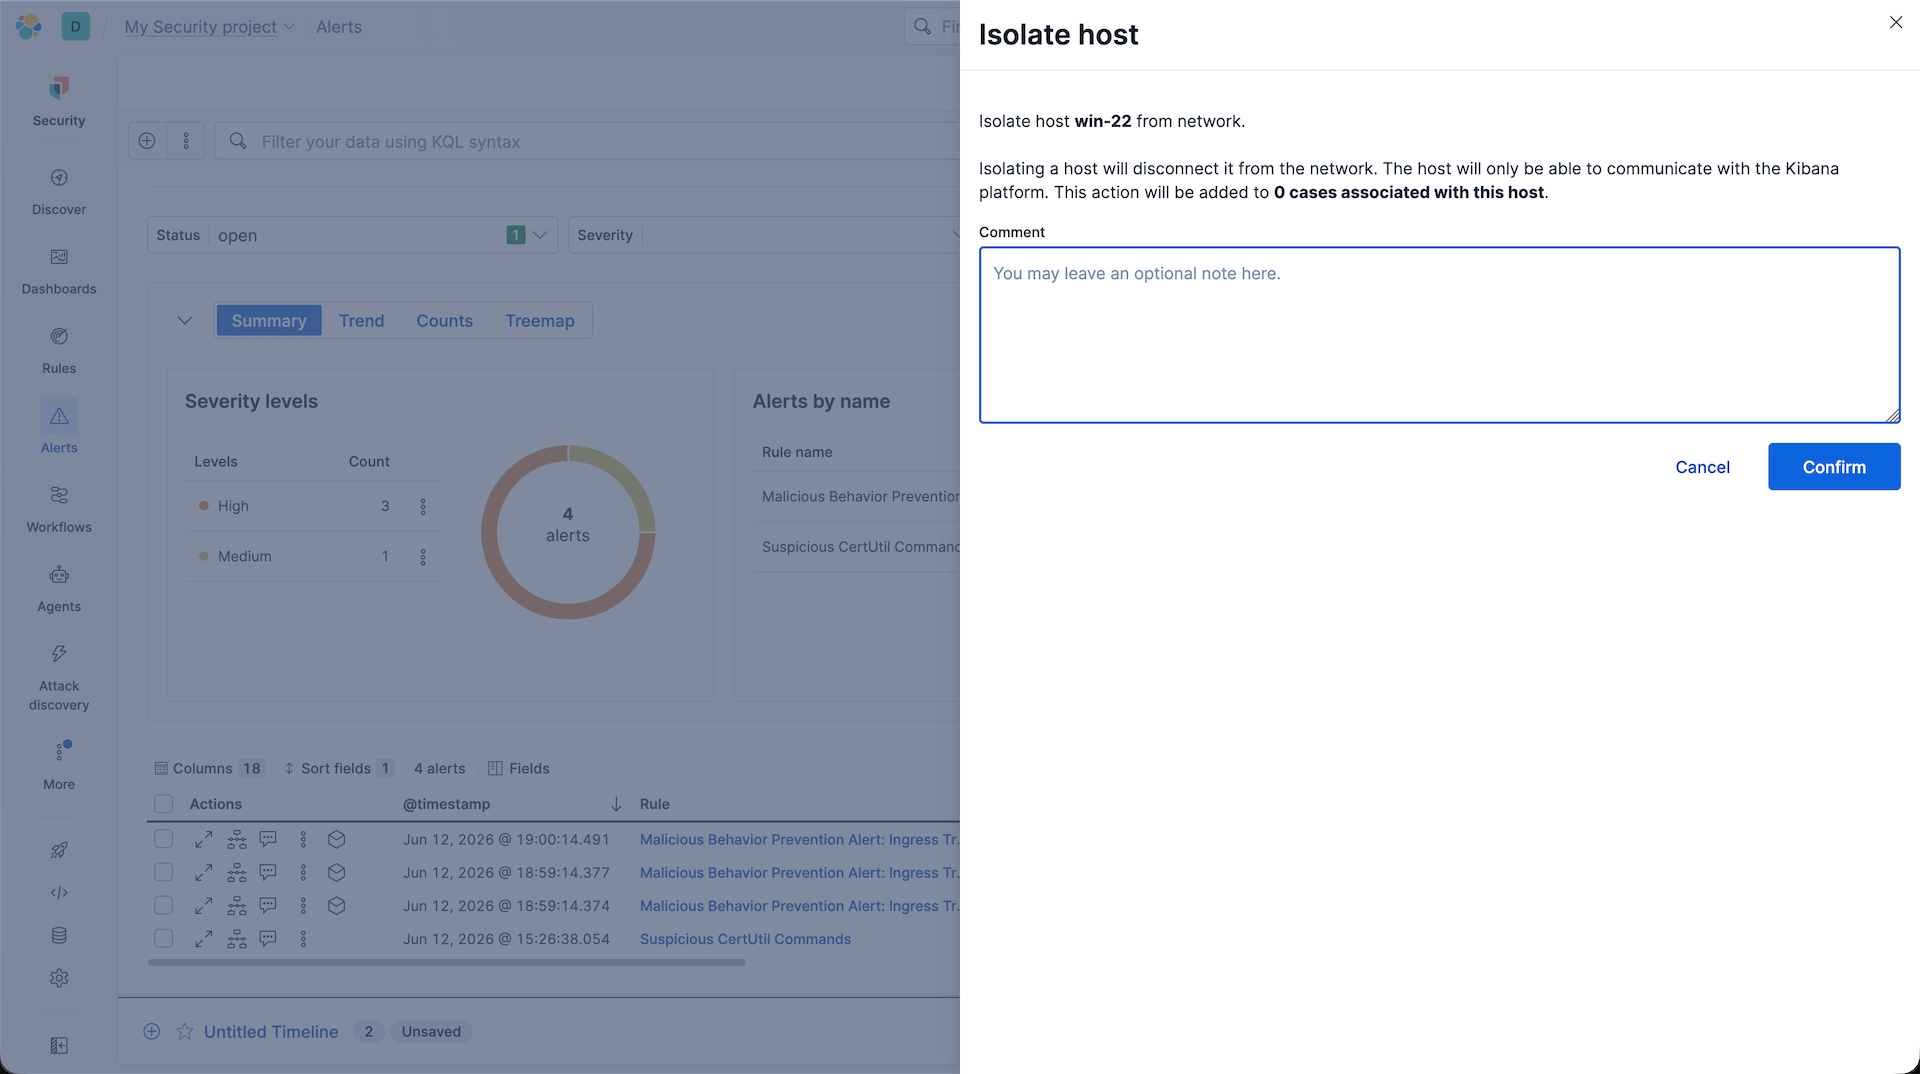
A confirmation modal alerts us that isolating the host will disconnect it from the network, limiting its communication exclusively to the Kibana management server. We confirm the action.
With the host successfully isolated, the dashboard updates, replacing the isolation action with a Release host button.
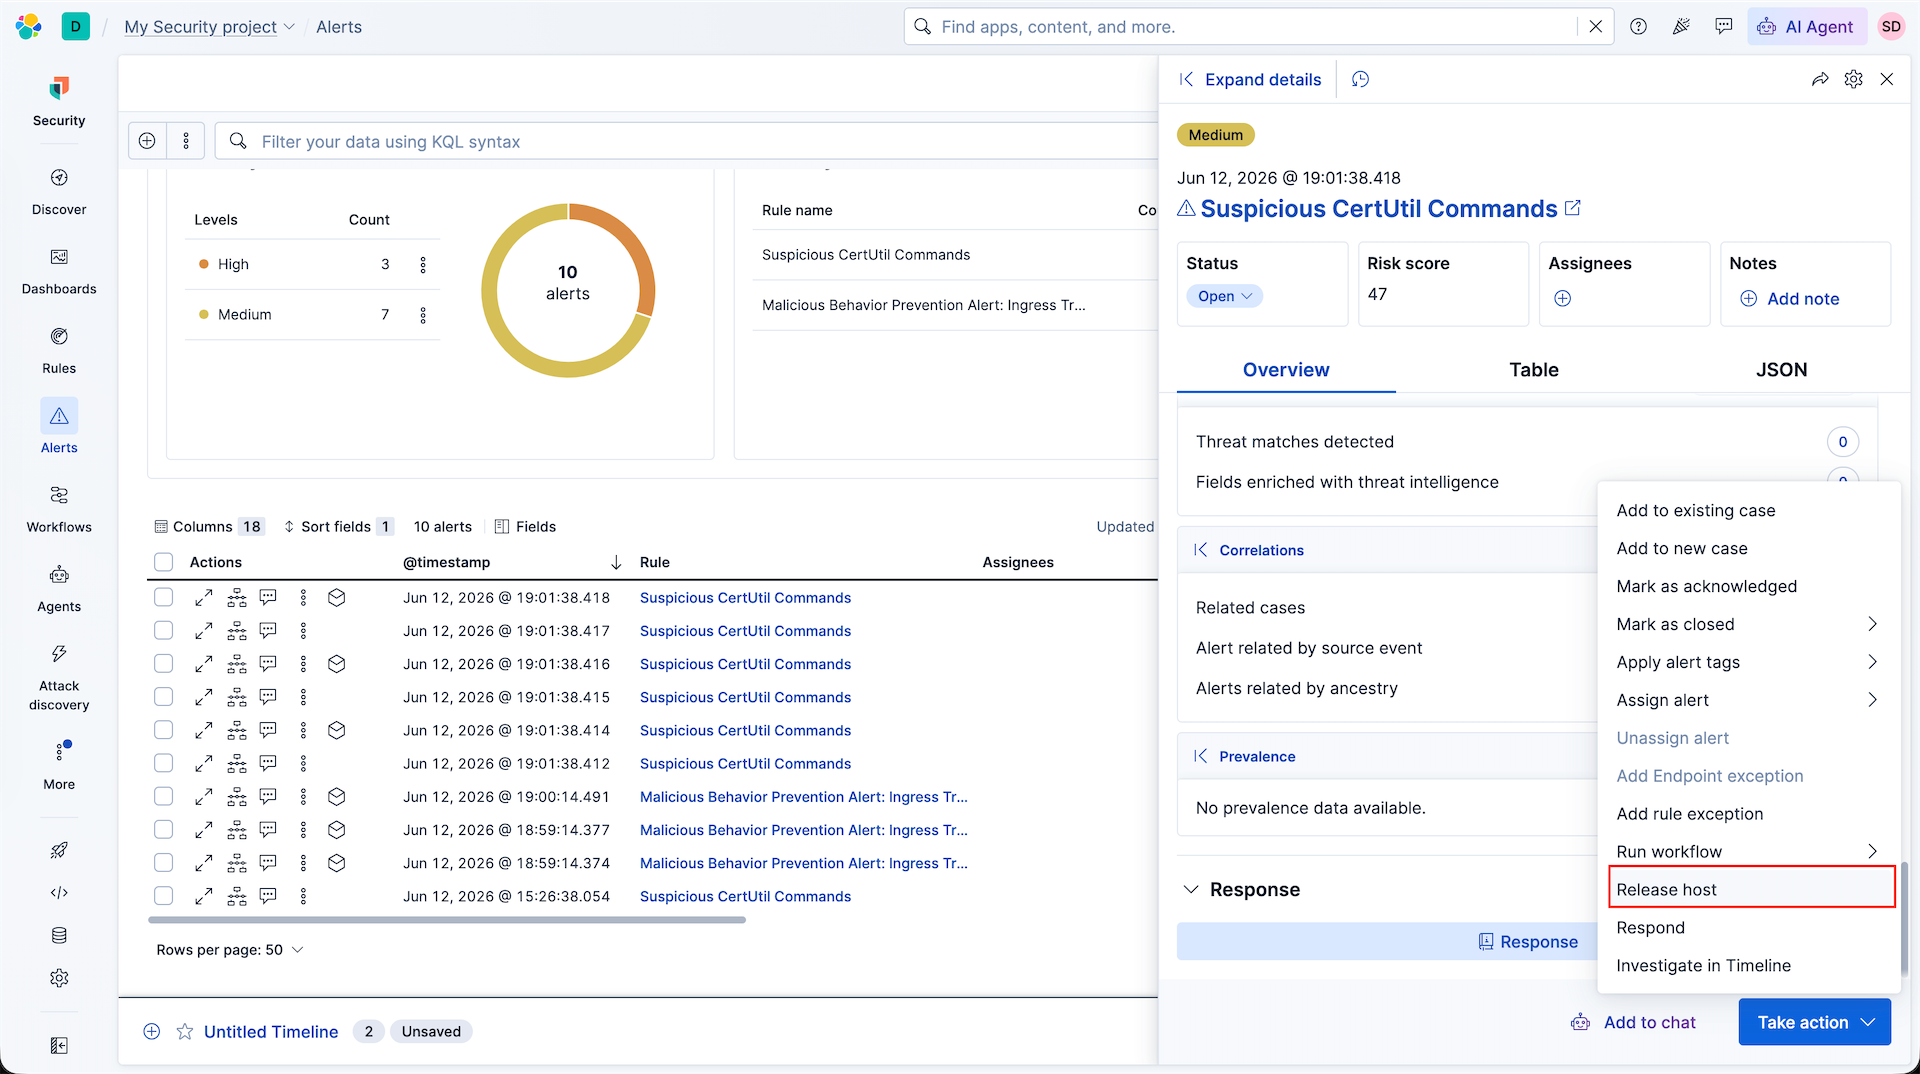
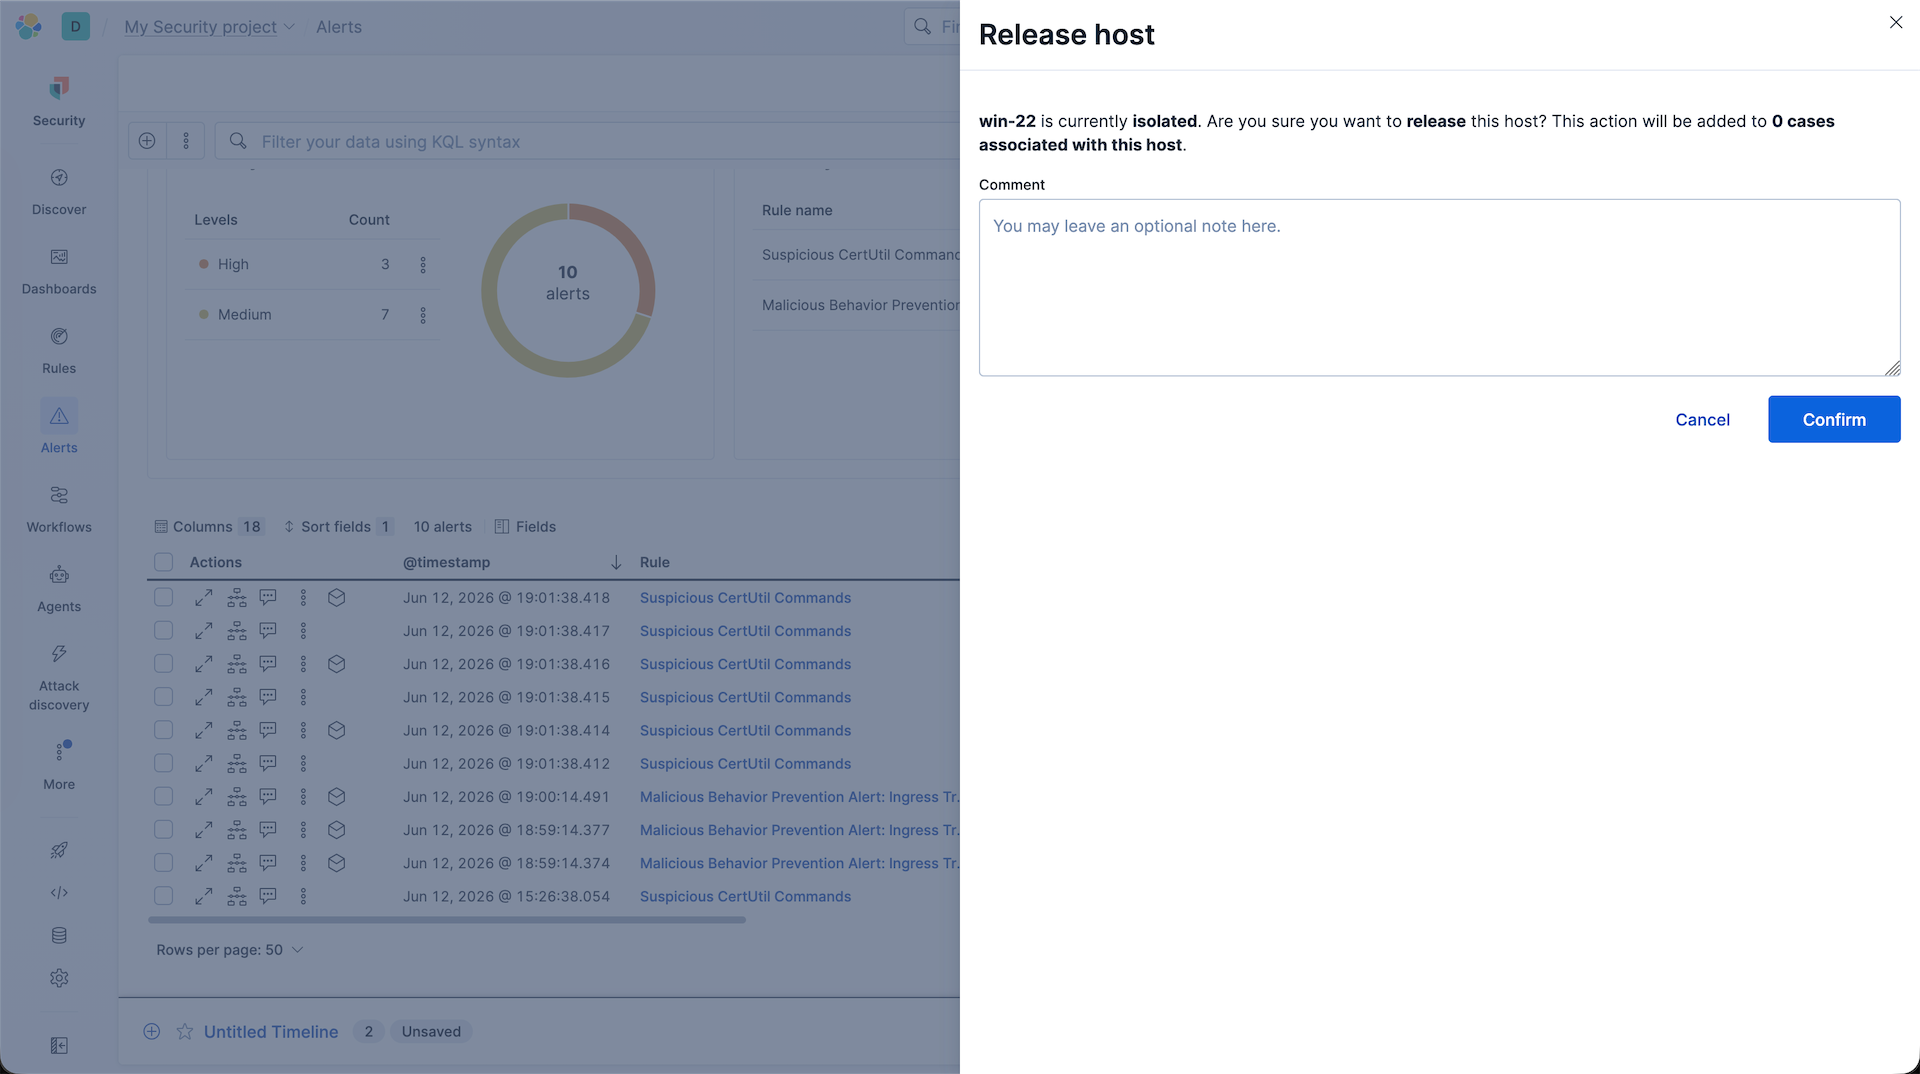
After completing our investigation, we click Release host and confirm to restore normal network connectivity to the target machine.
AI-Driven Attack Auto-Discovery
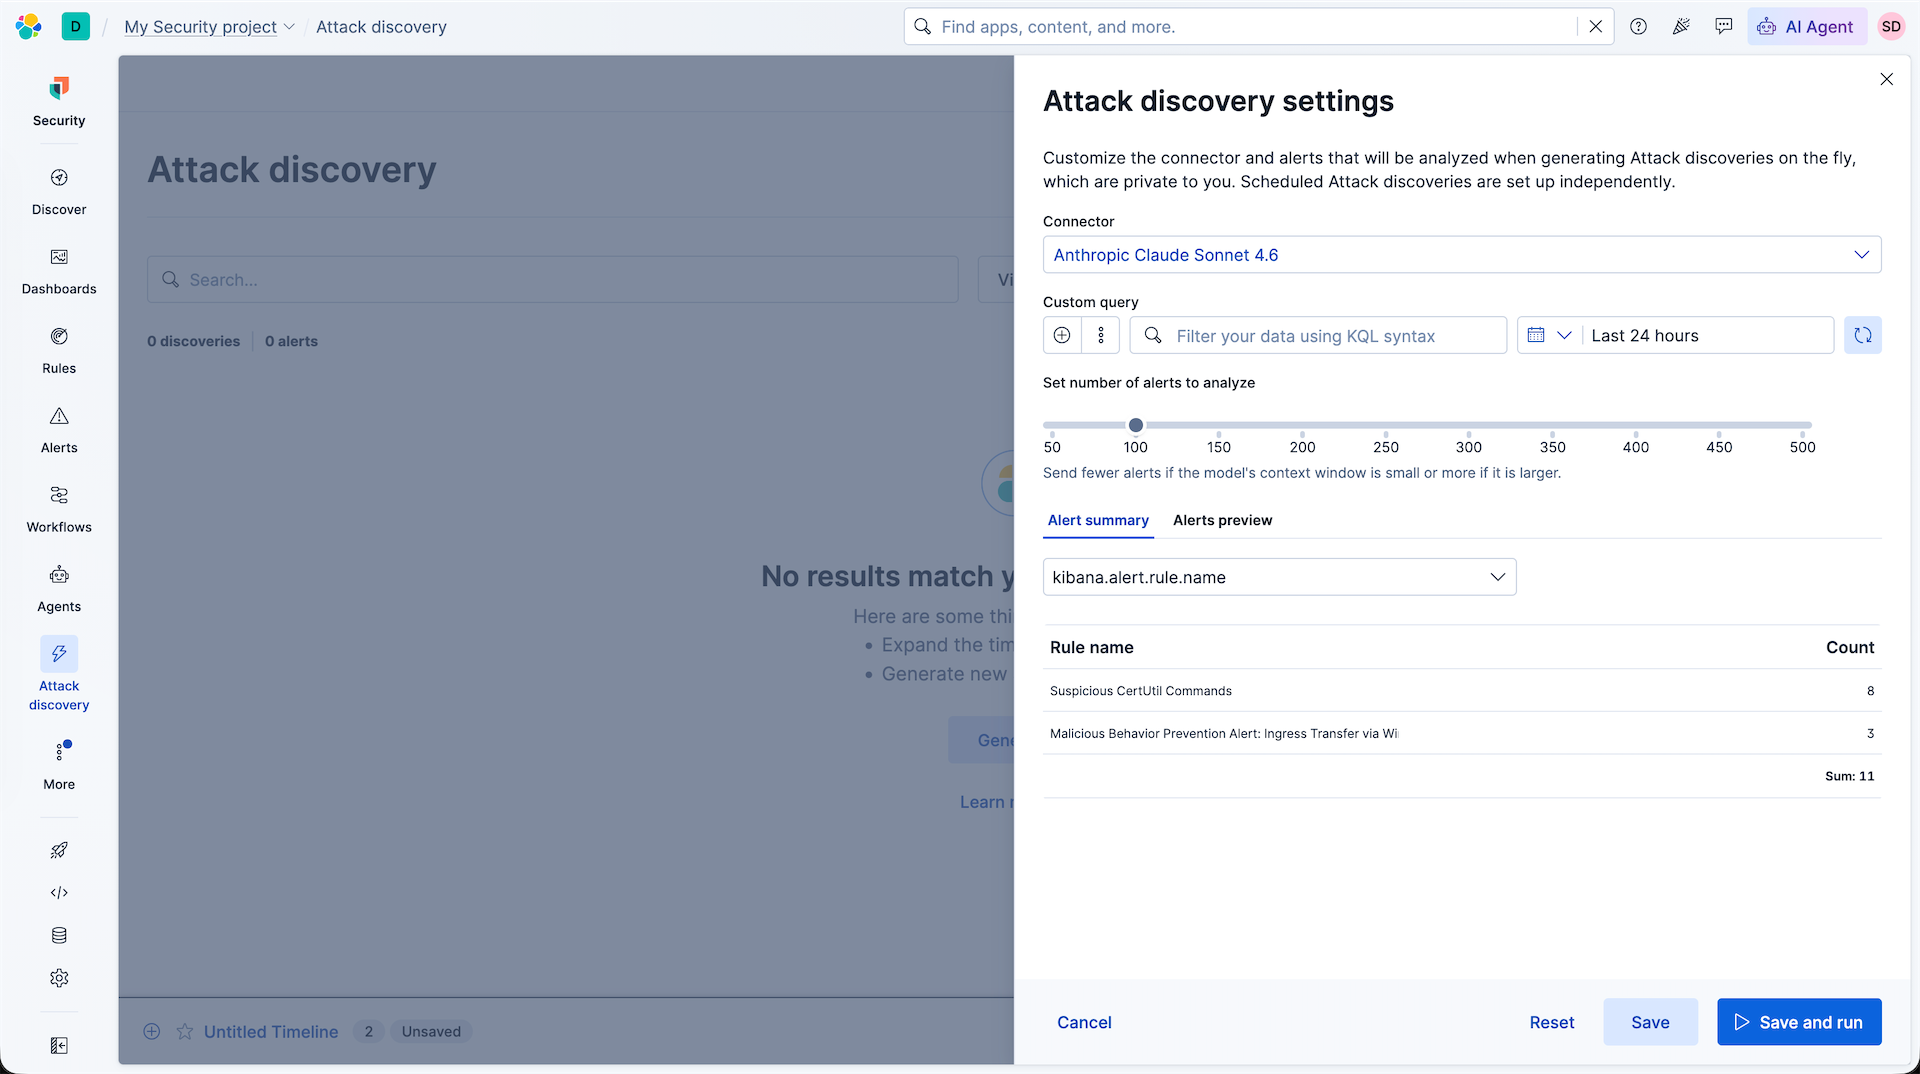
Finally, we leverage generative AI to analyze and summarize the threat sequence on the fly. We open the Attack Discovery settings page and configure Anthropic Claude Sonnet 4.6 as our connector model to evaluate alerts.
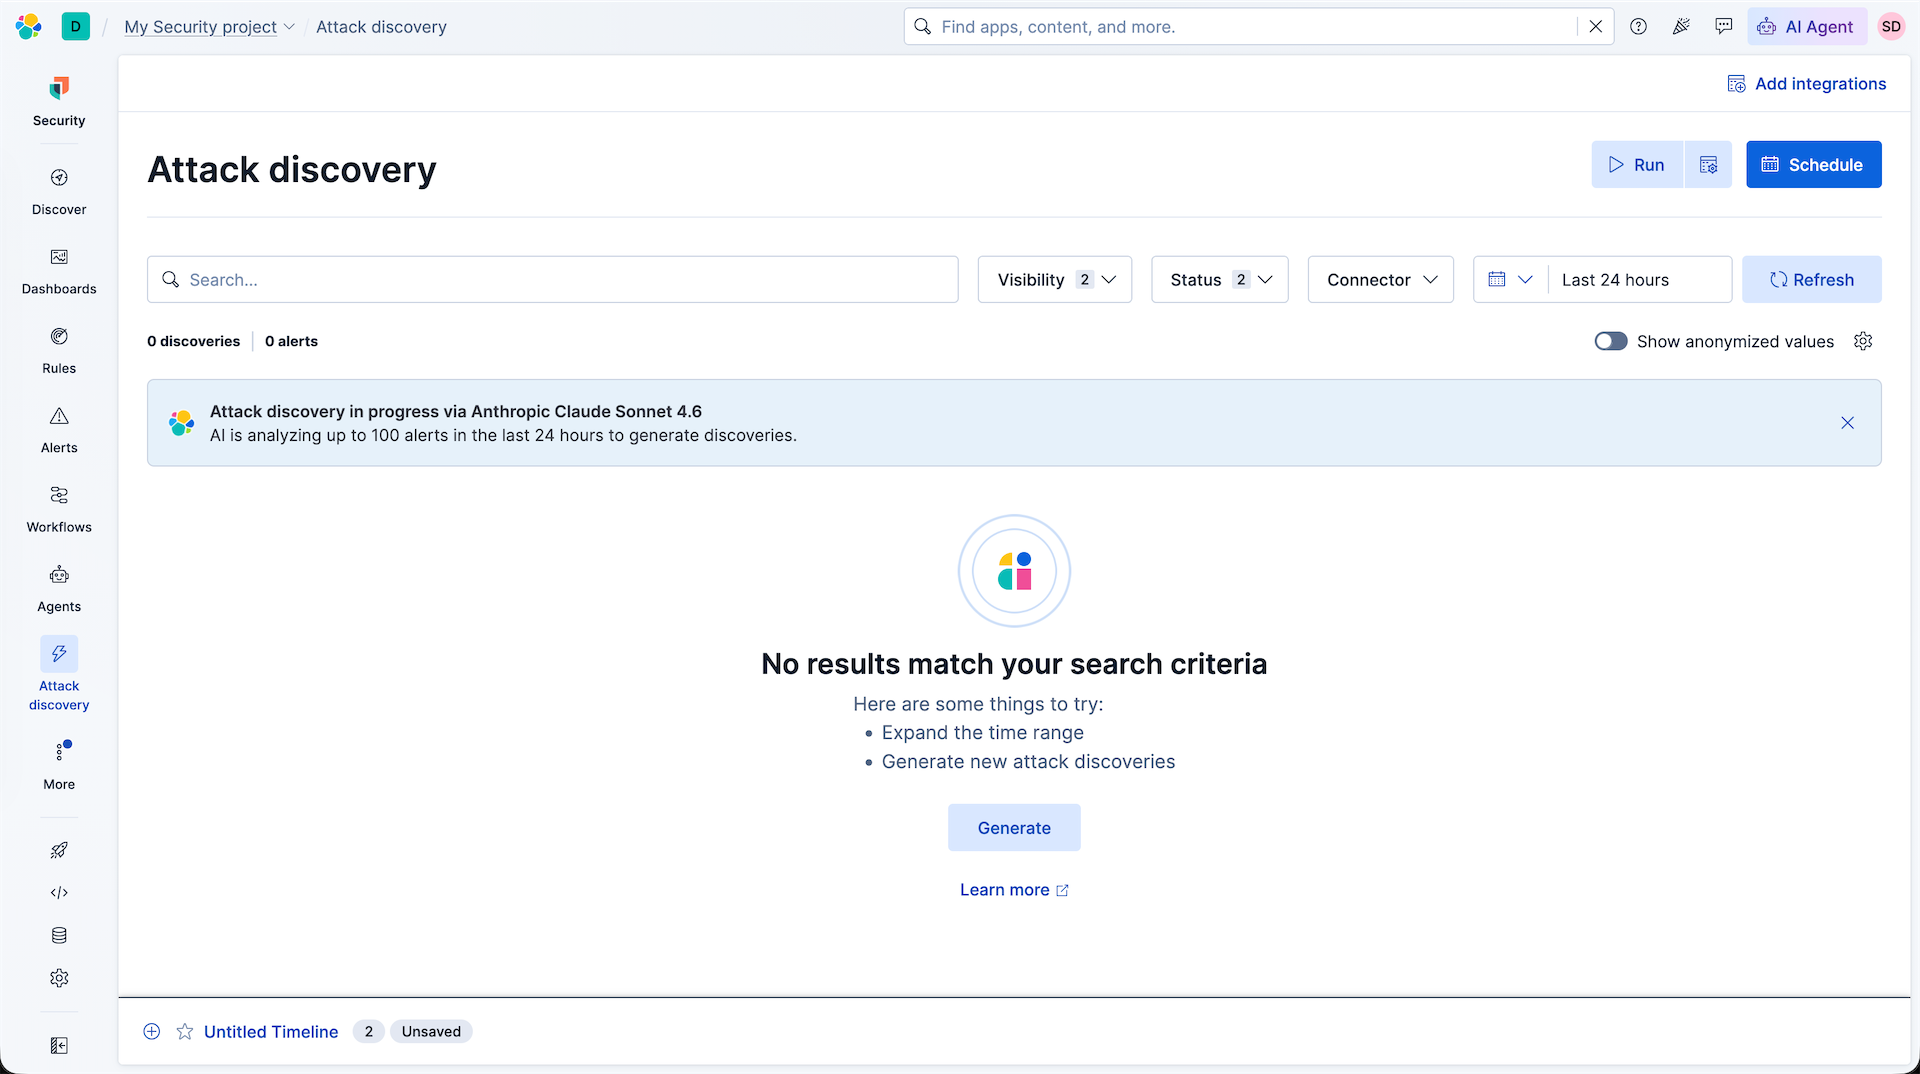
The AI engine begins analyzing the alerts collected during the last 24 hours.
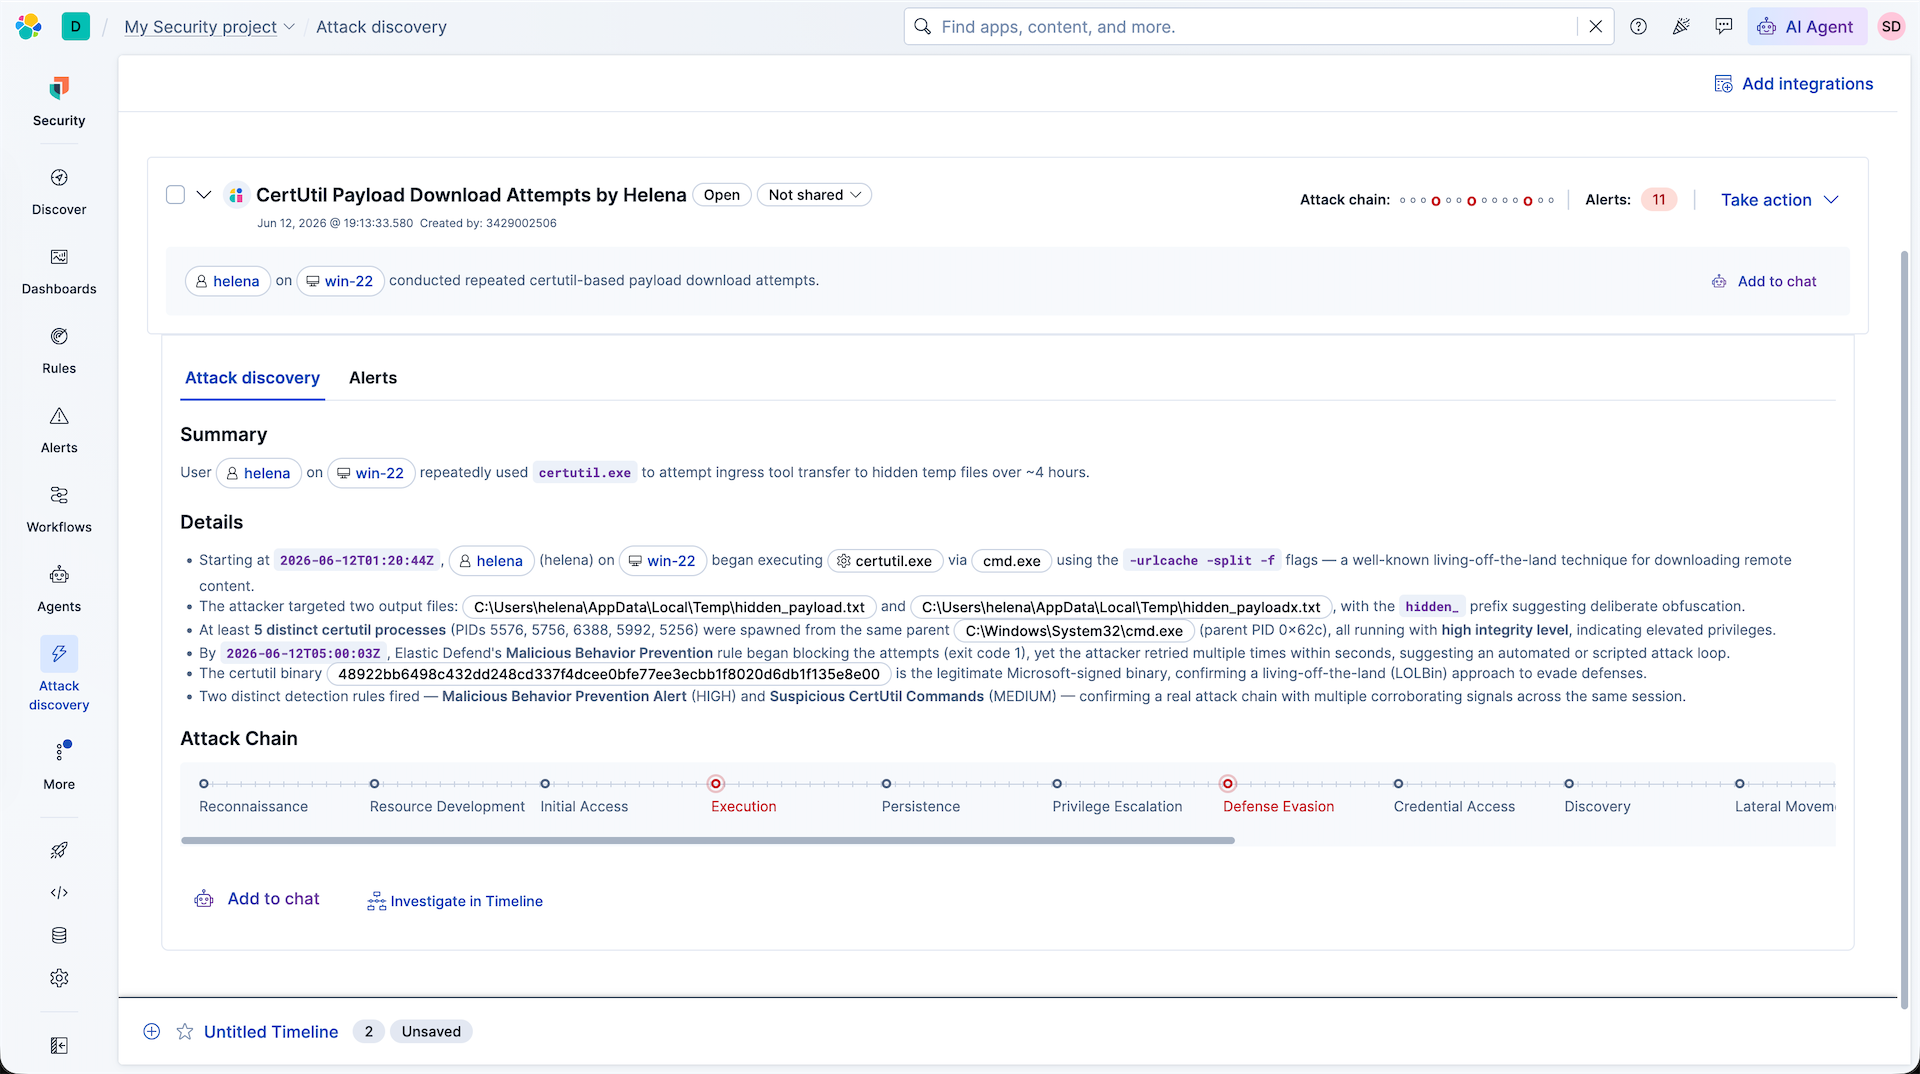
The auto-discovery yields a detailed attack story titled CertUtil Payload Download Attempts by Helena. The AI correlates multiple corroborating alert signals, explaining that user helena repeatedly invoked certutil.exe via cmd.exe to retrieve remote payloads into temp paths, and highlights that the final attempts were blocked by Elastic Defend’s Malicious Behavior Prevention engine.