Cisco ThousandEyes is a synthetic monitoring platform that acts as a fleet of automated users, giving us hop-by-hop visibility into local network routing, global internet paths, and application performance.
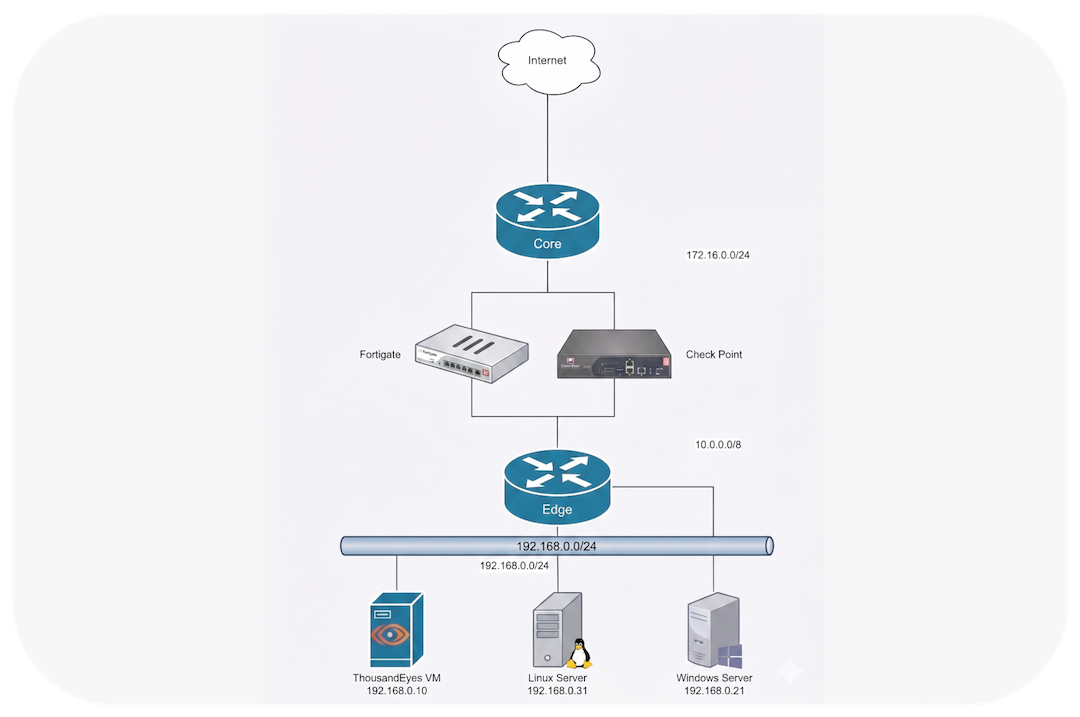
In this lab, we build a comprehensive 360-degree monitoring strategy using three distinct vantage points:
- Virtual Appliance (TE VA): A dedicated internal VM serving as the baseline monitor for our core network.
- Catalyst 8000v Enterprise Agent: A containerized probe embedded directly in the edge router.
- Windows 10 Endpoint Agent: A lightweight background app measuring the true, end-to-end user experience.
Cisco allows us to try ThousandEyes for 15 days, we can request it directly at cisco.com
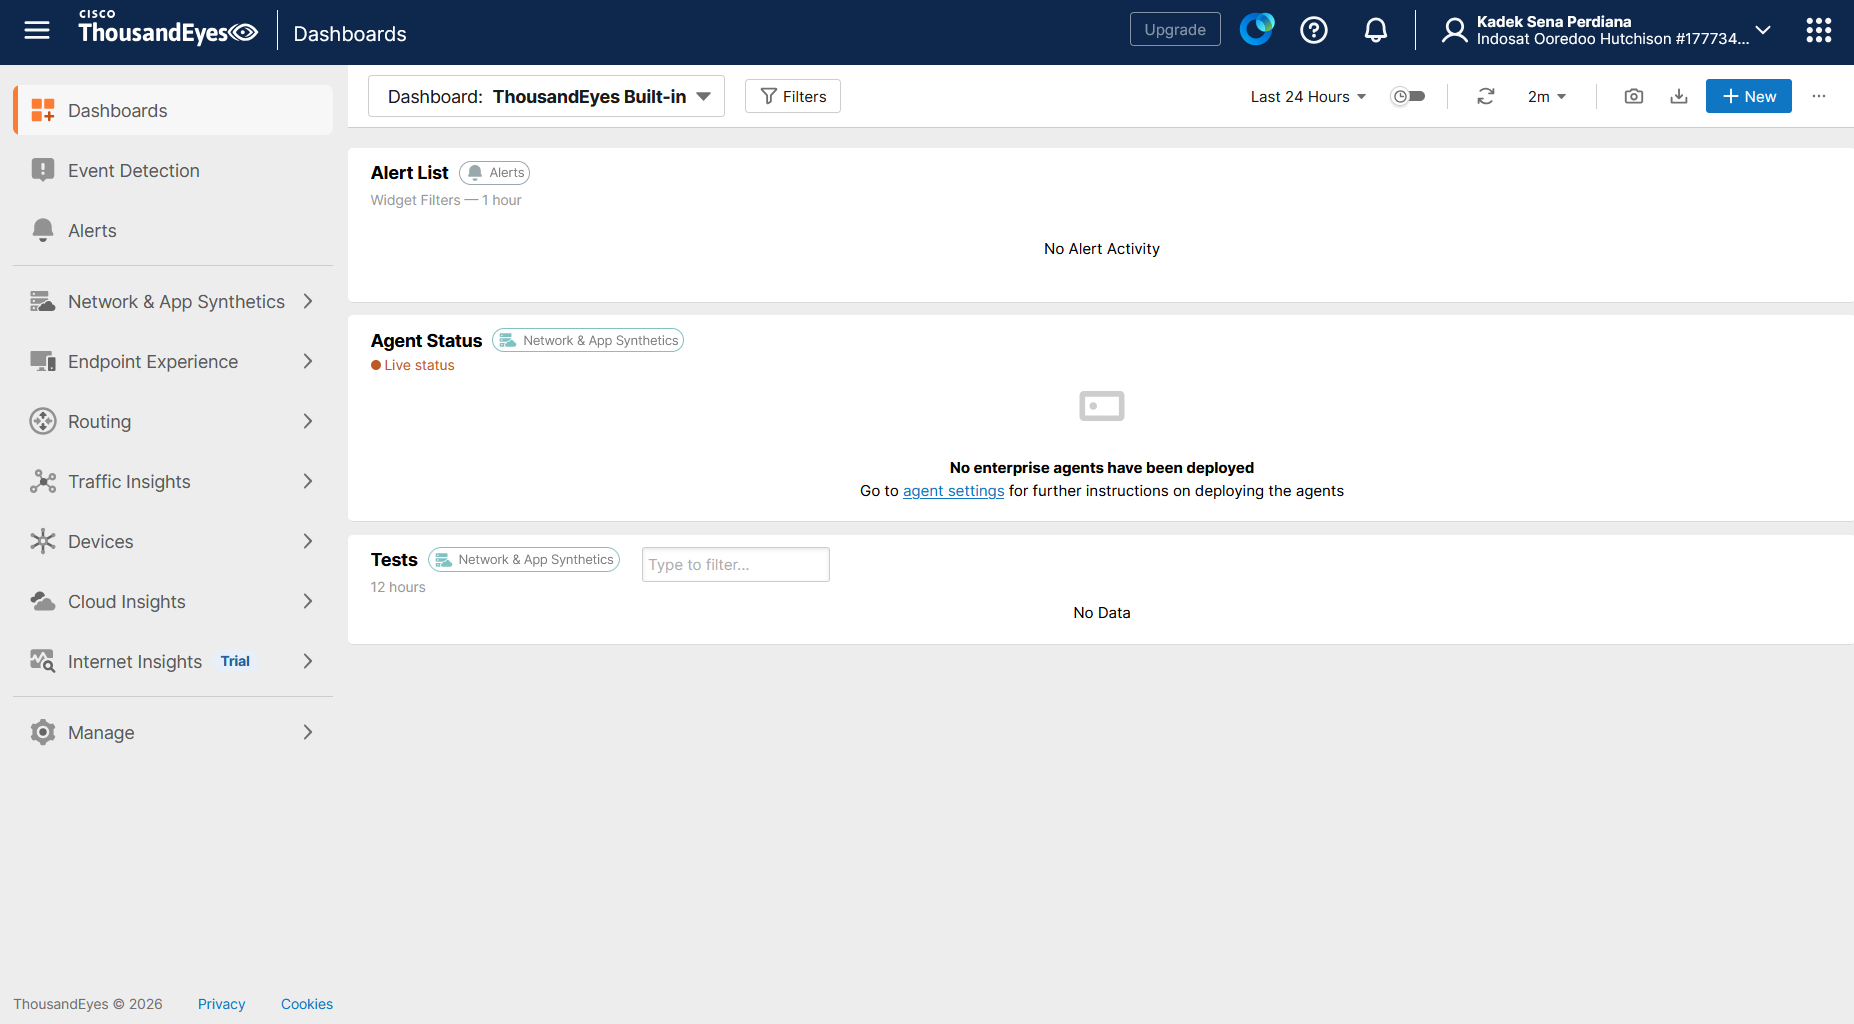
TE works by using Agents that periodically perform network testing, so here we will deploy some Enterprise Agents
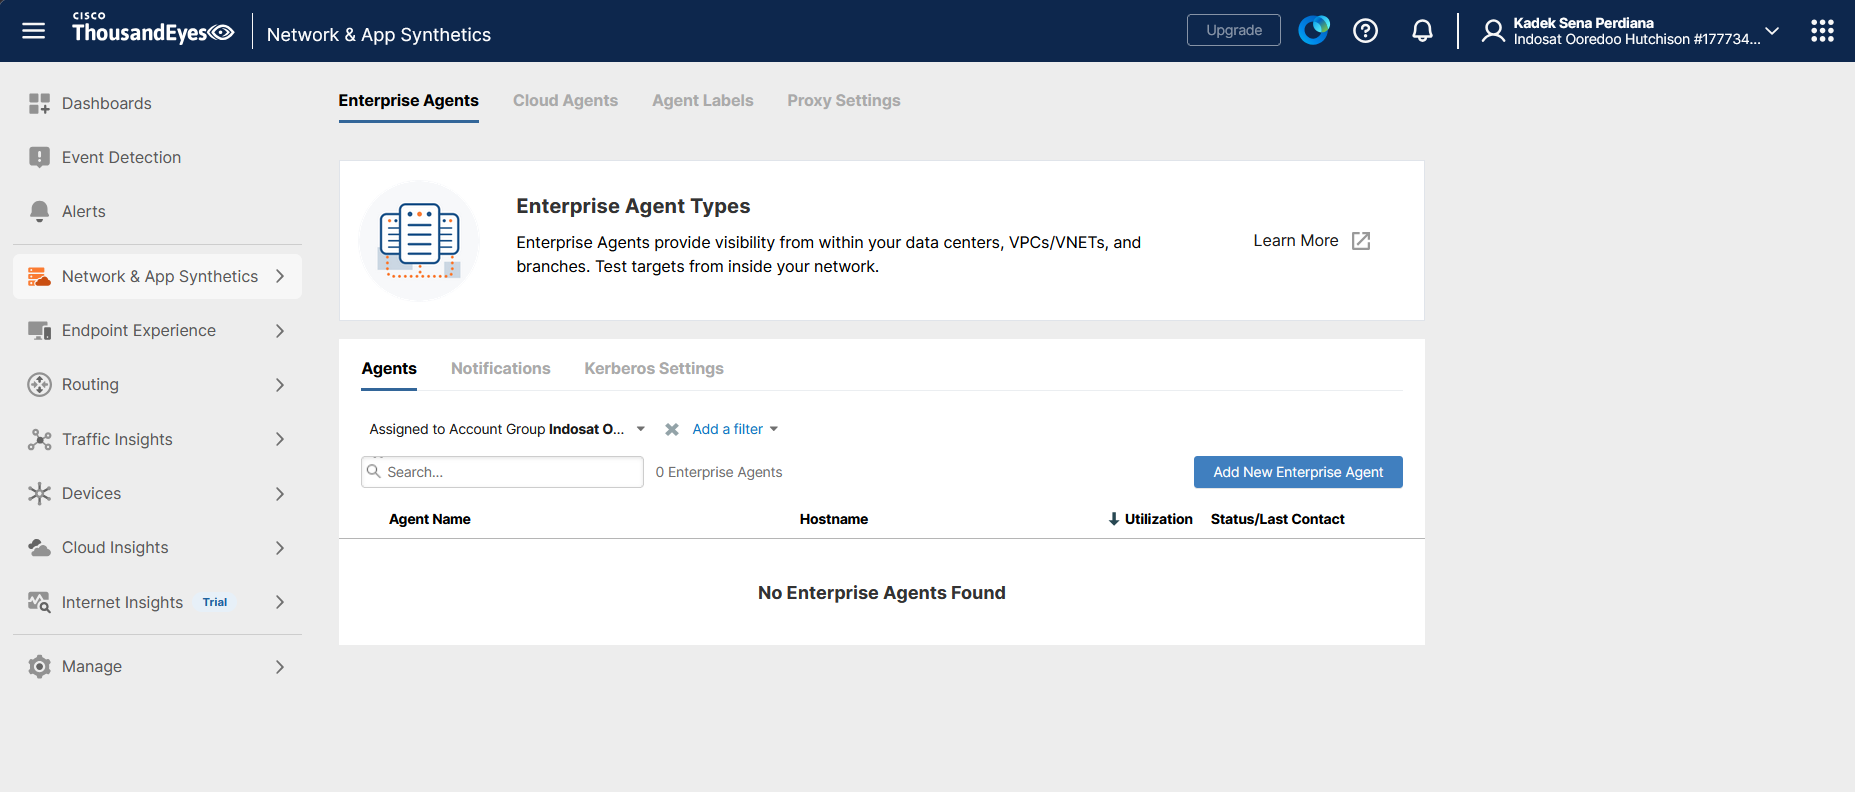
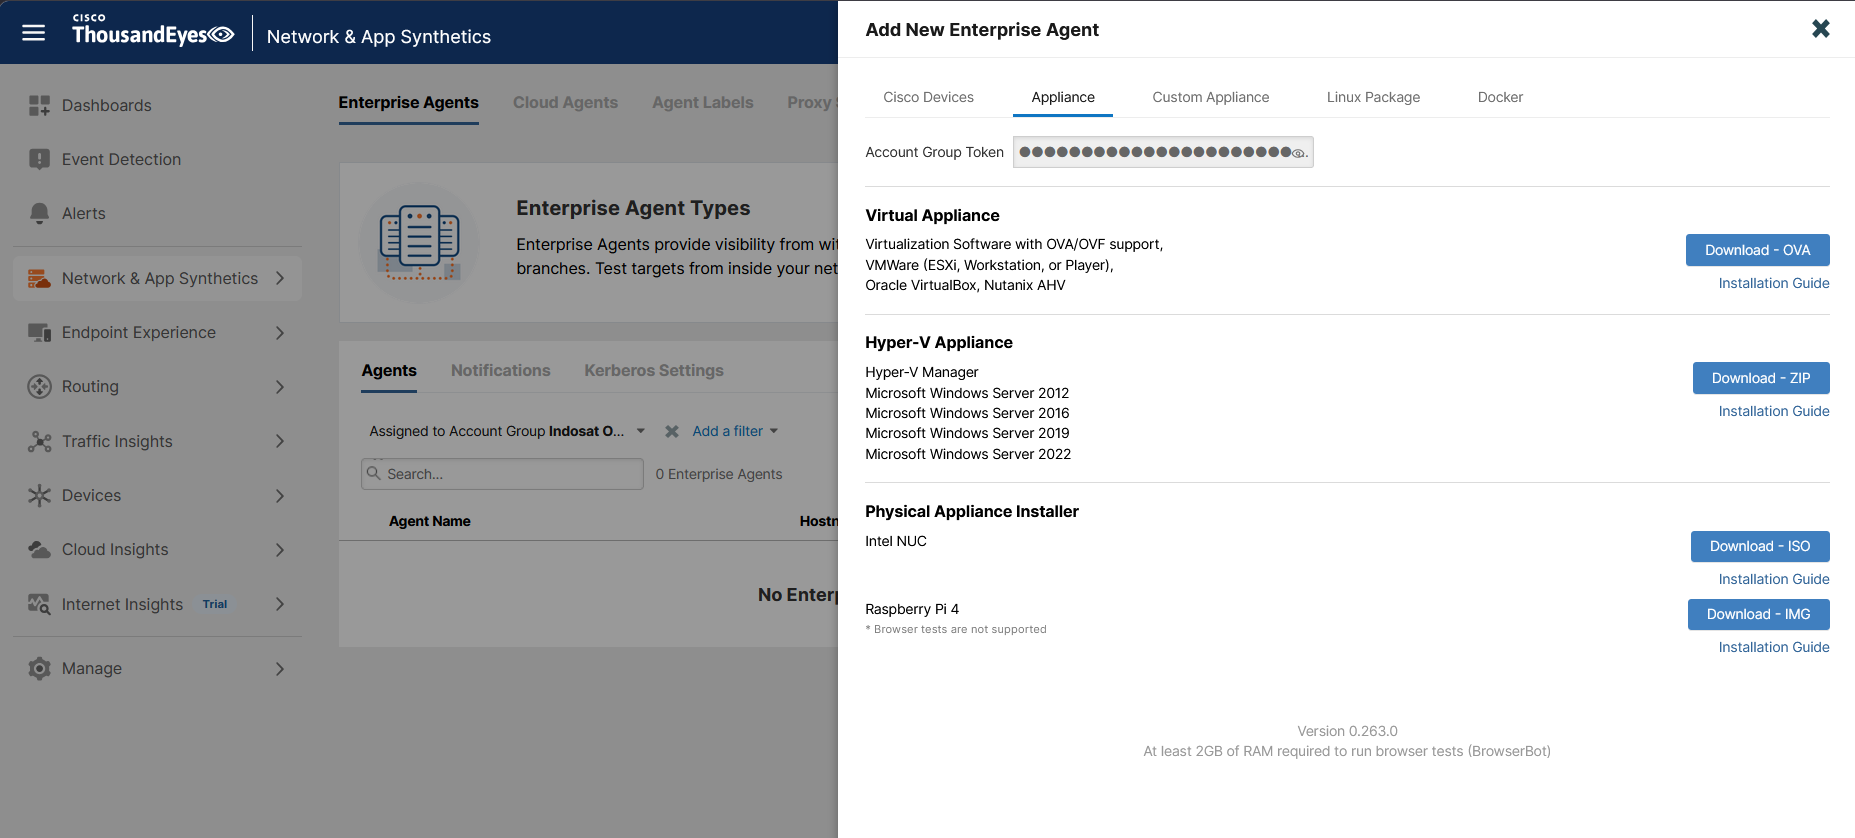
Appliance Agent
First we will add an Appliance Agent that sits behind our Edge router, here we download the installer and copy the token
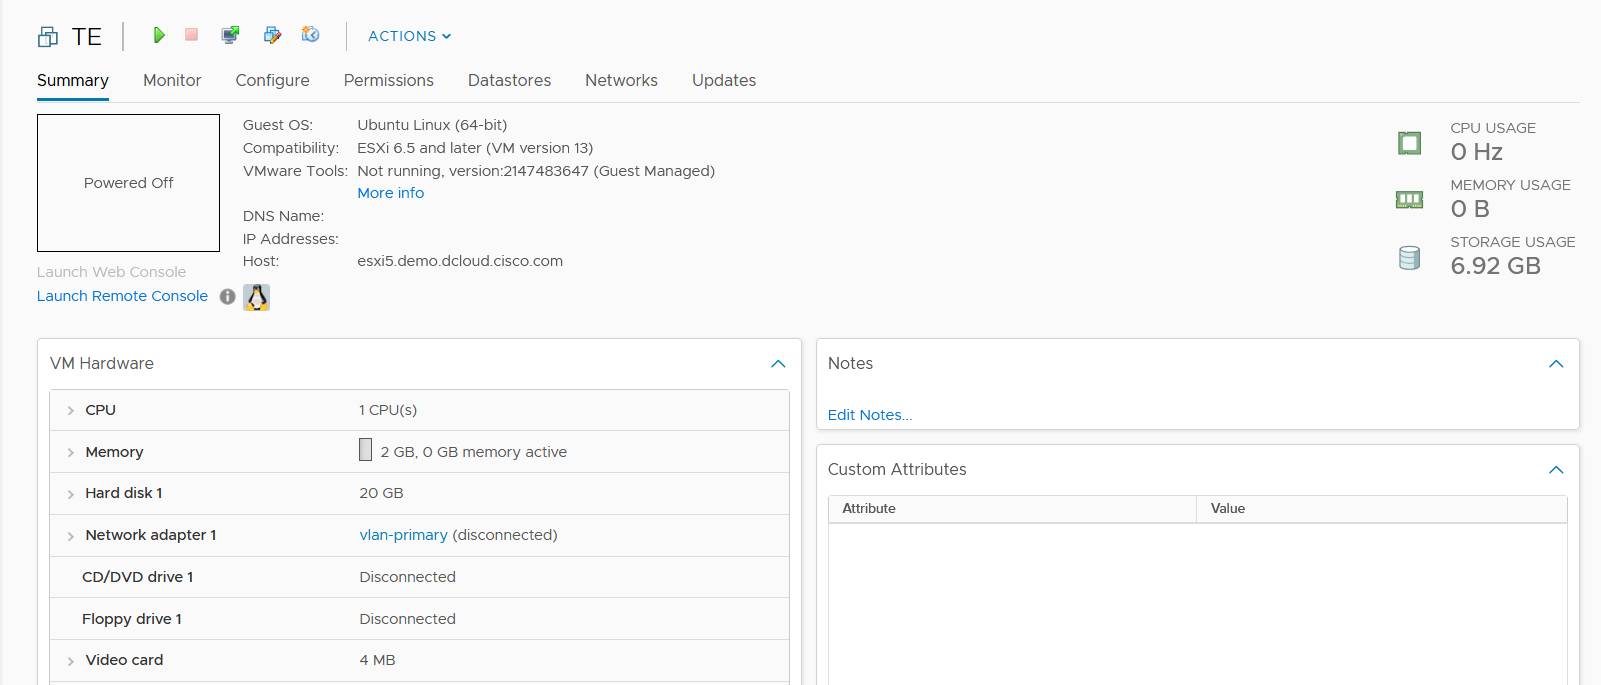
Then deploy the VM and run the instalation wizard
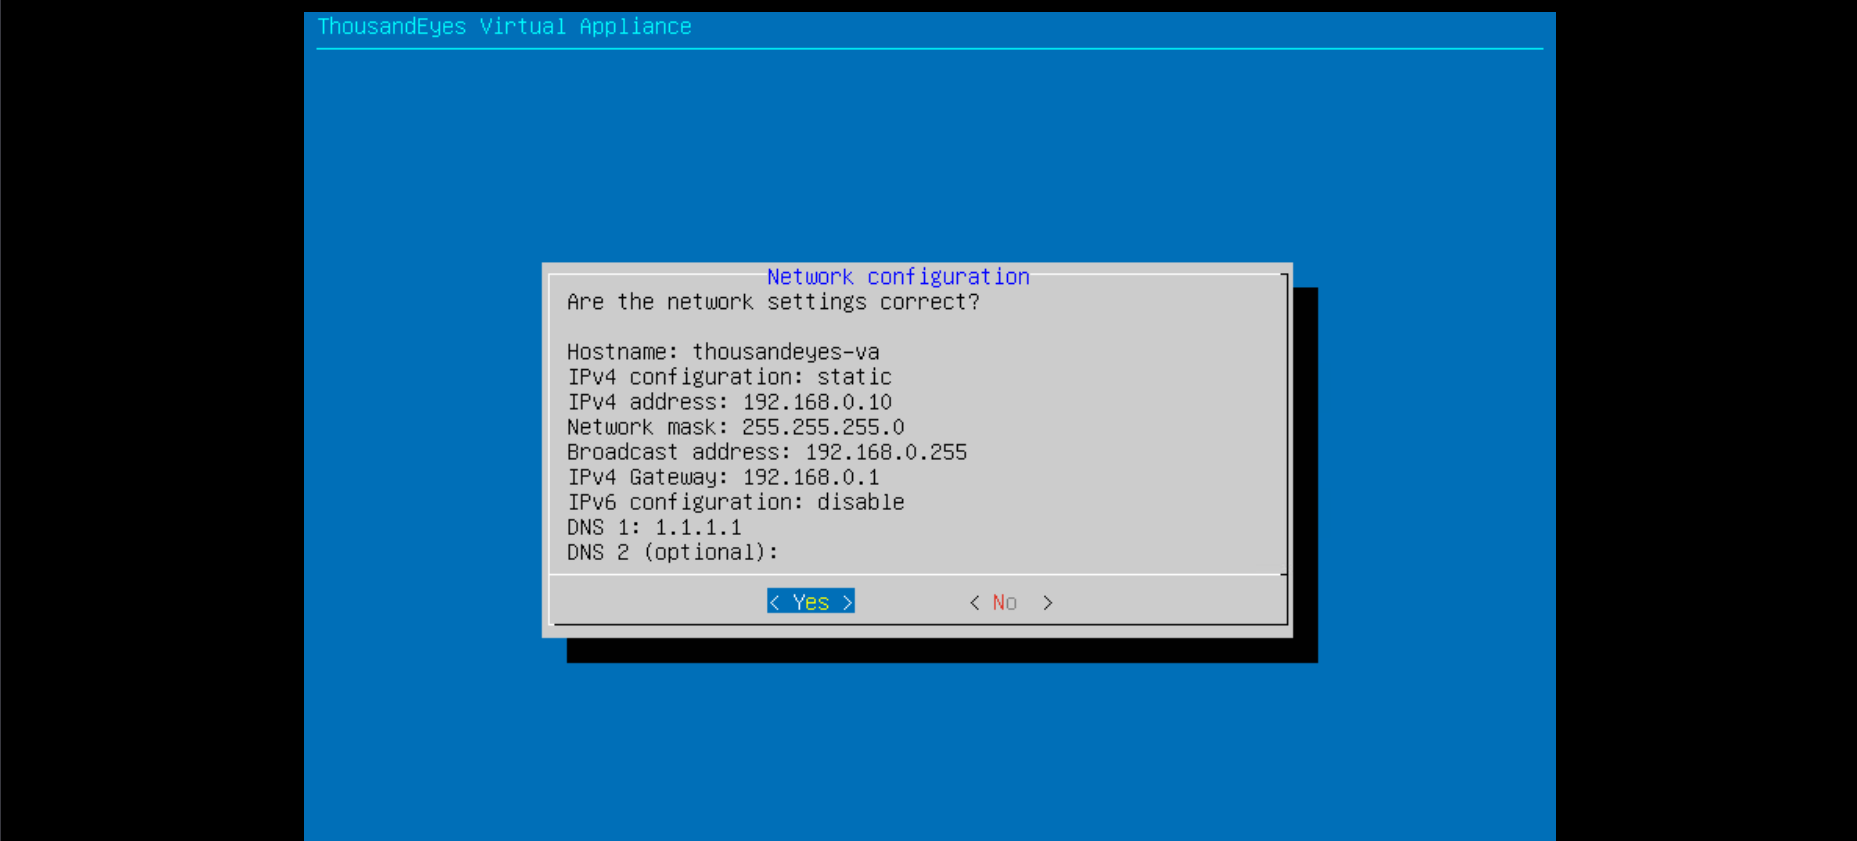
Configure the nettwork settings
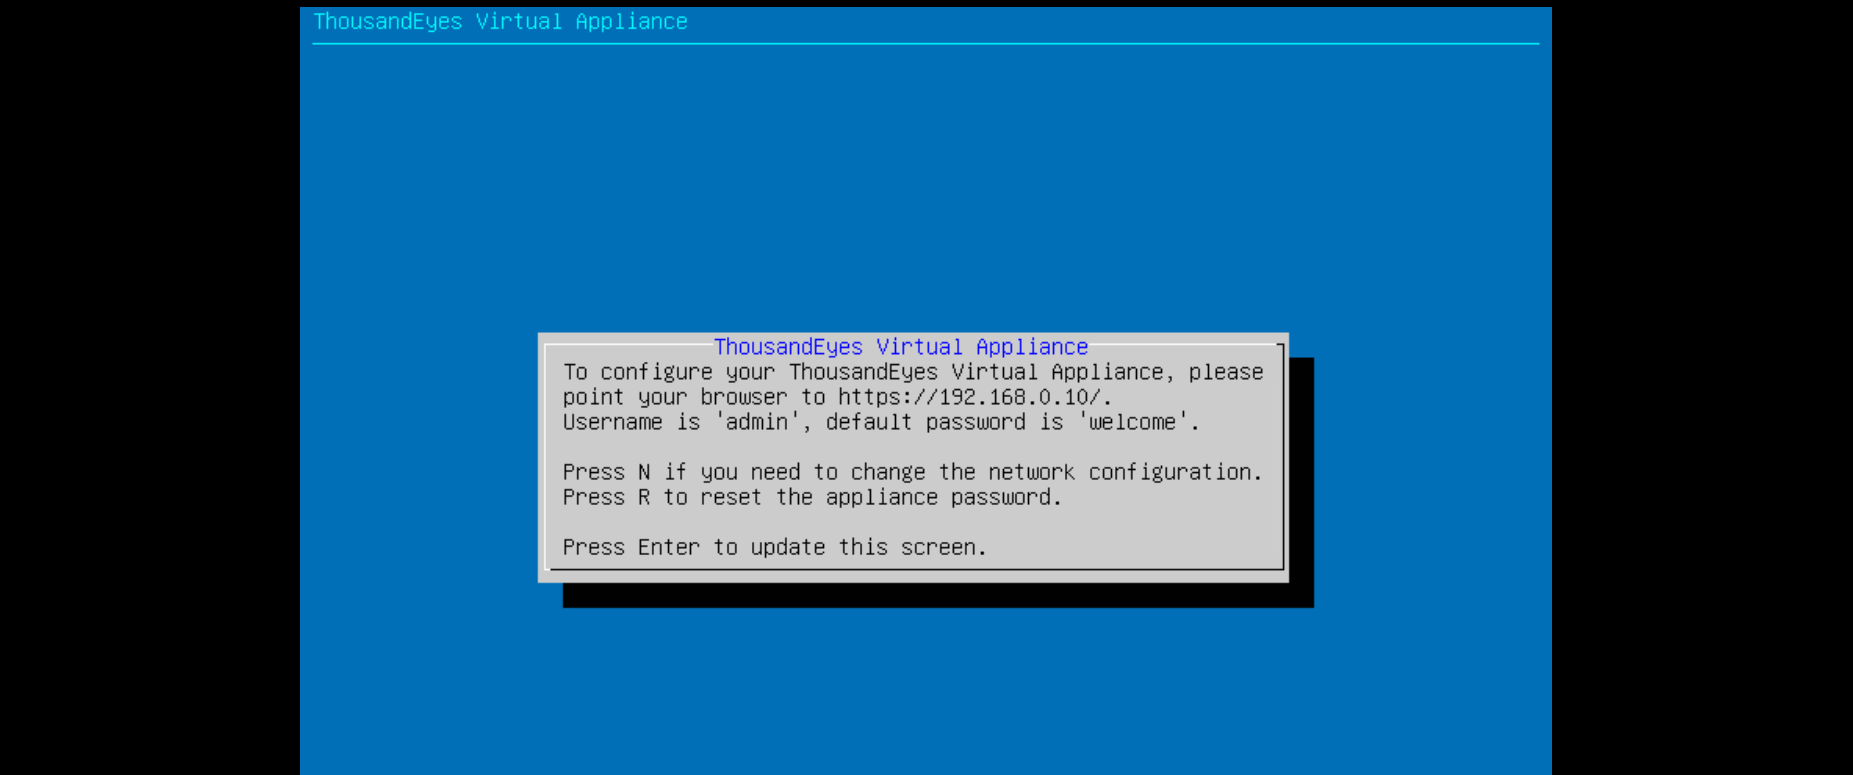
After that we will be able to access the GUI
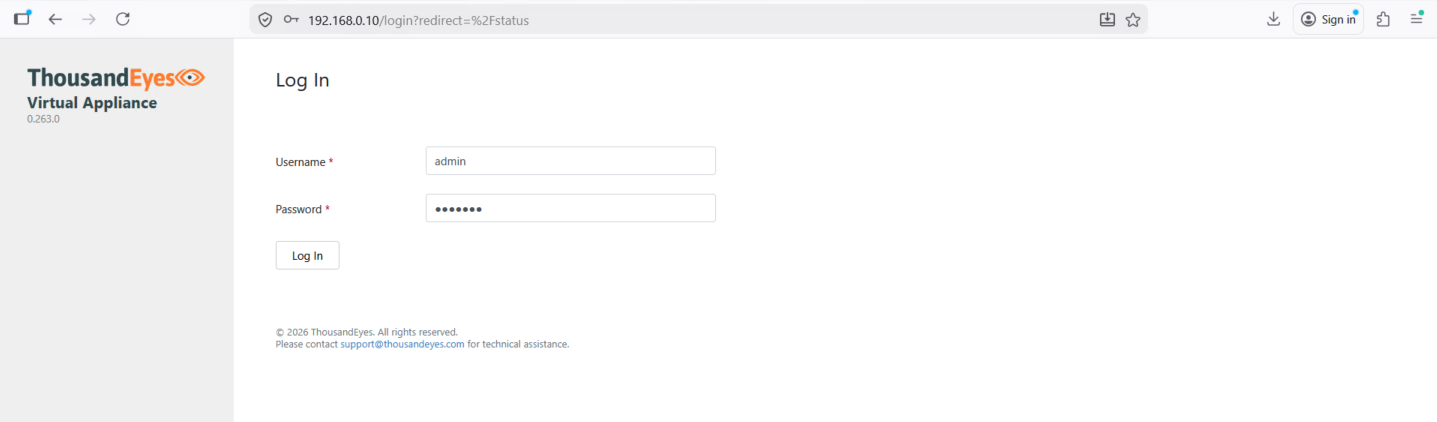
Here we enter the token and finish the configuration
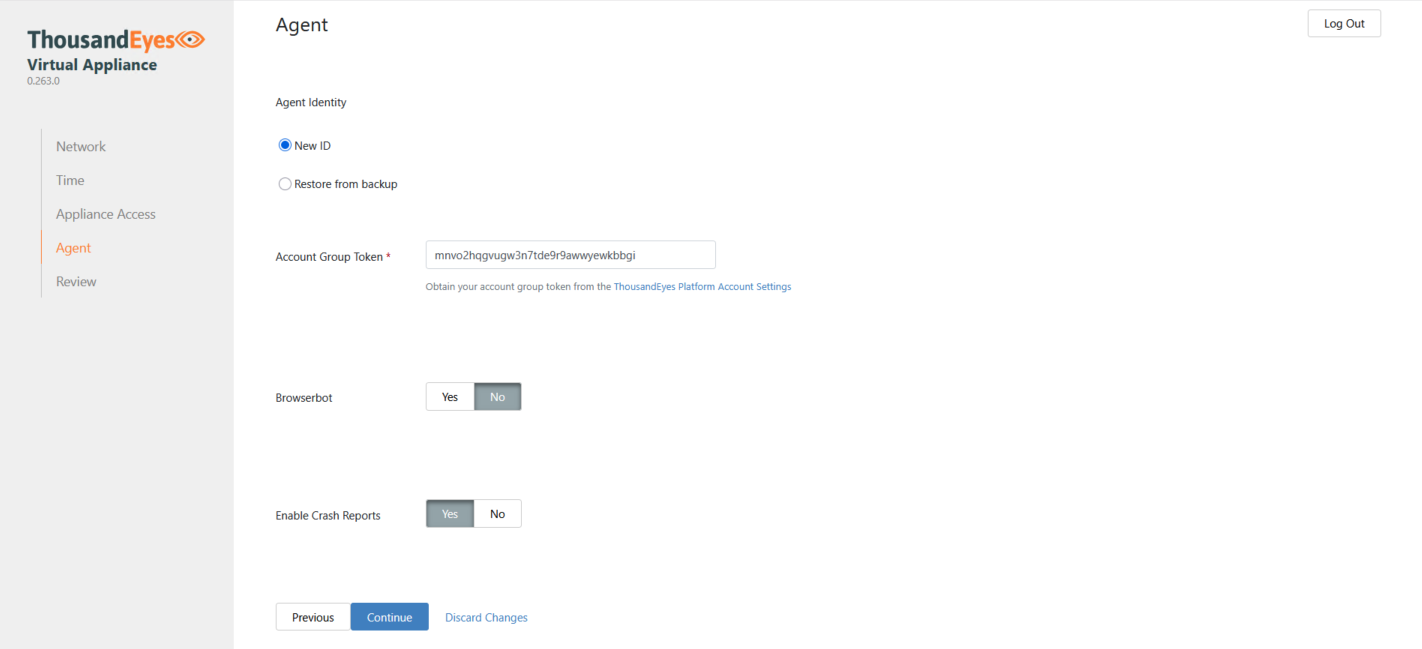
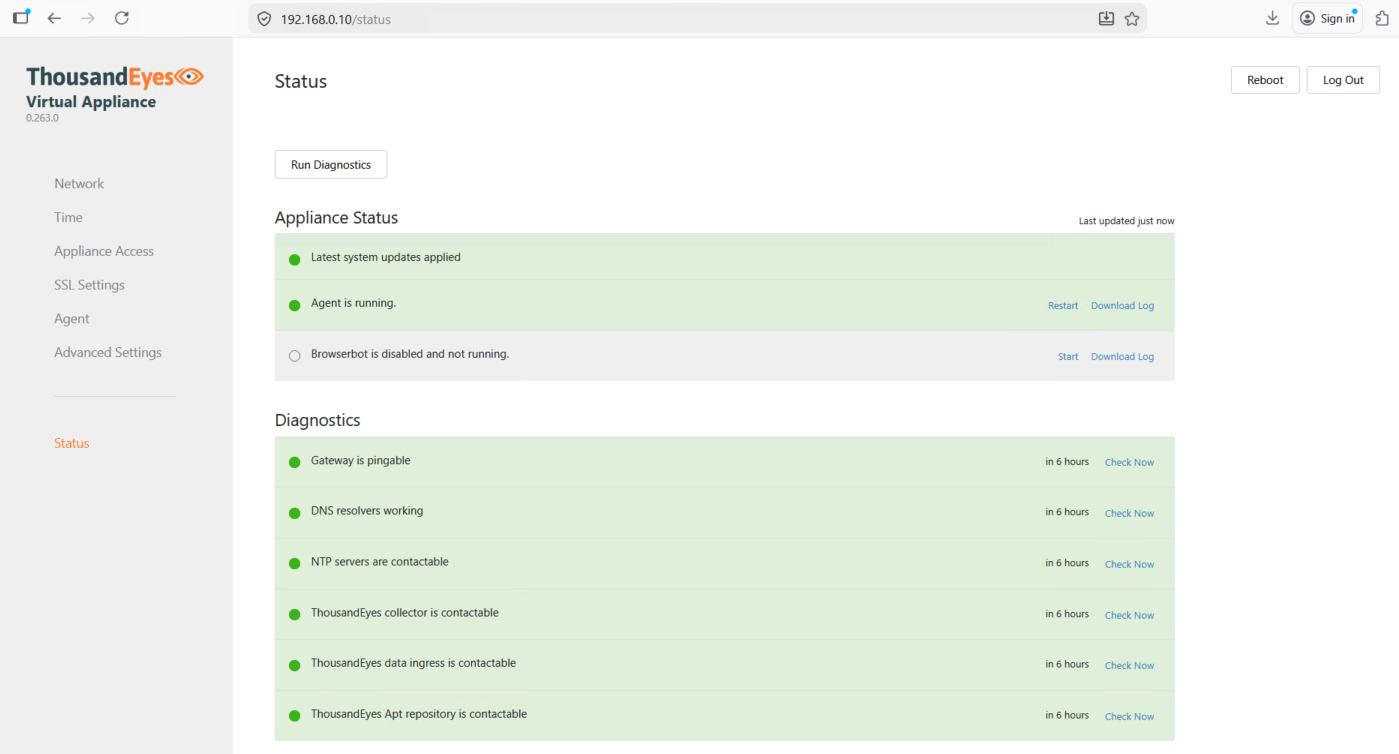
Ensure everything is green and we’re good to go
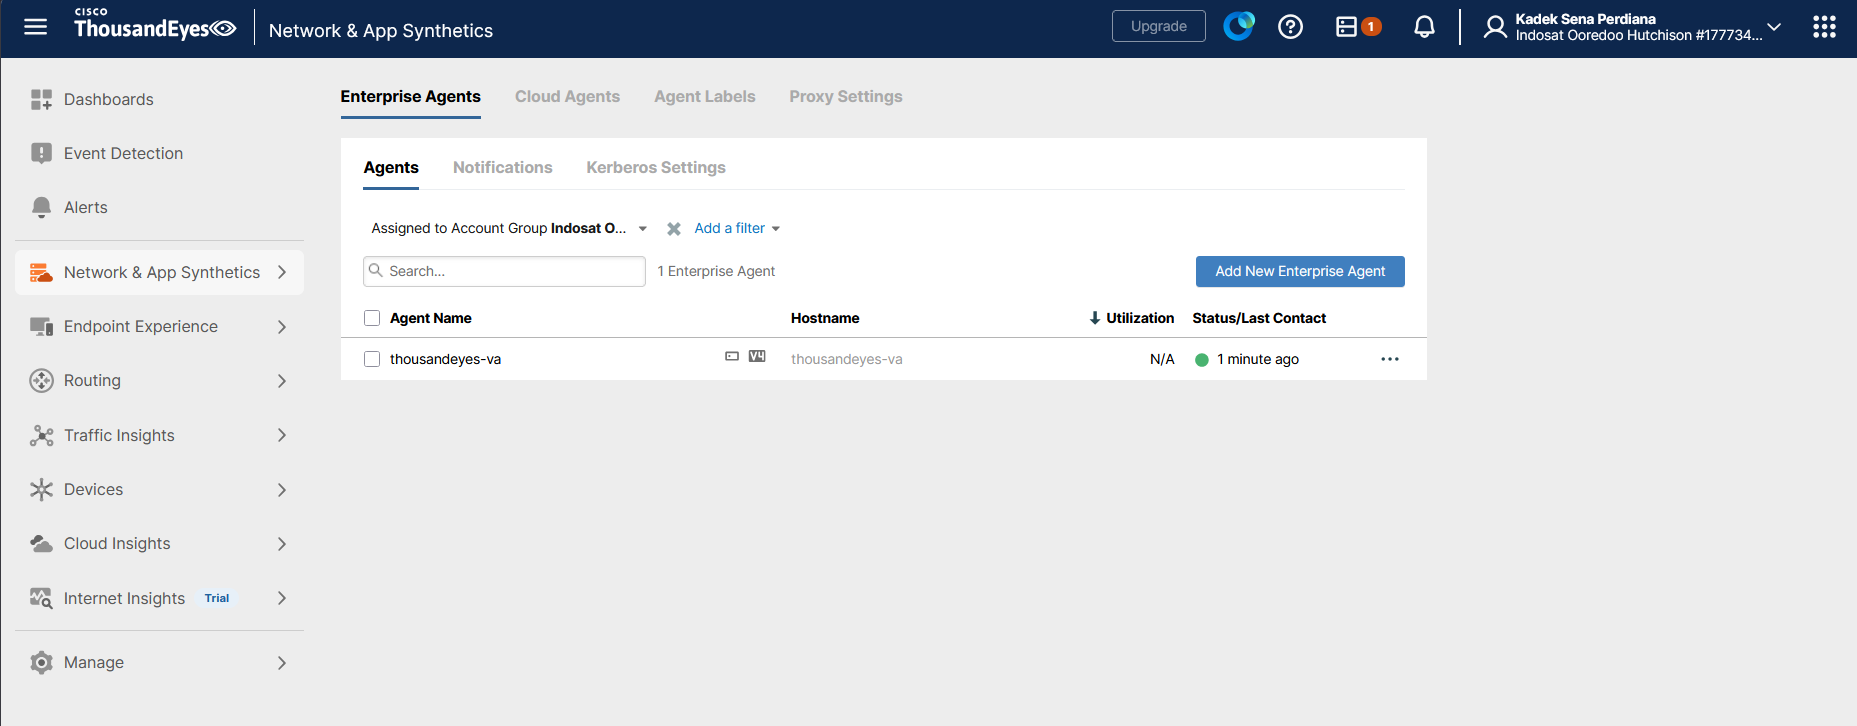
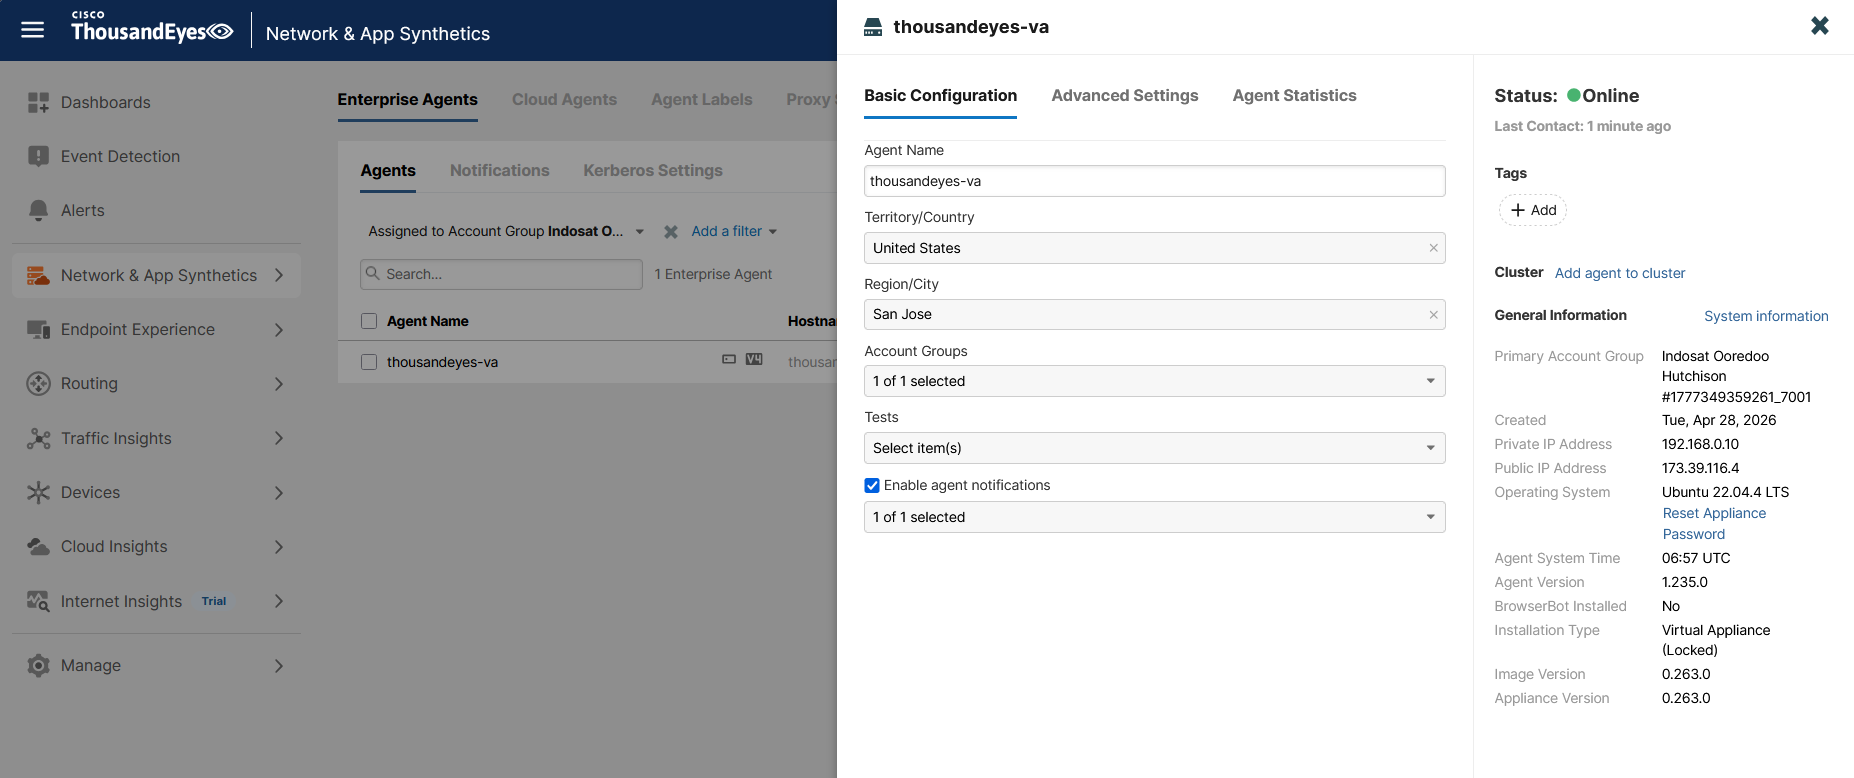
Back to the TE Portal, we will see our VA being registered in Agent Settings
Cisco Agent
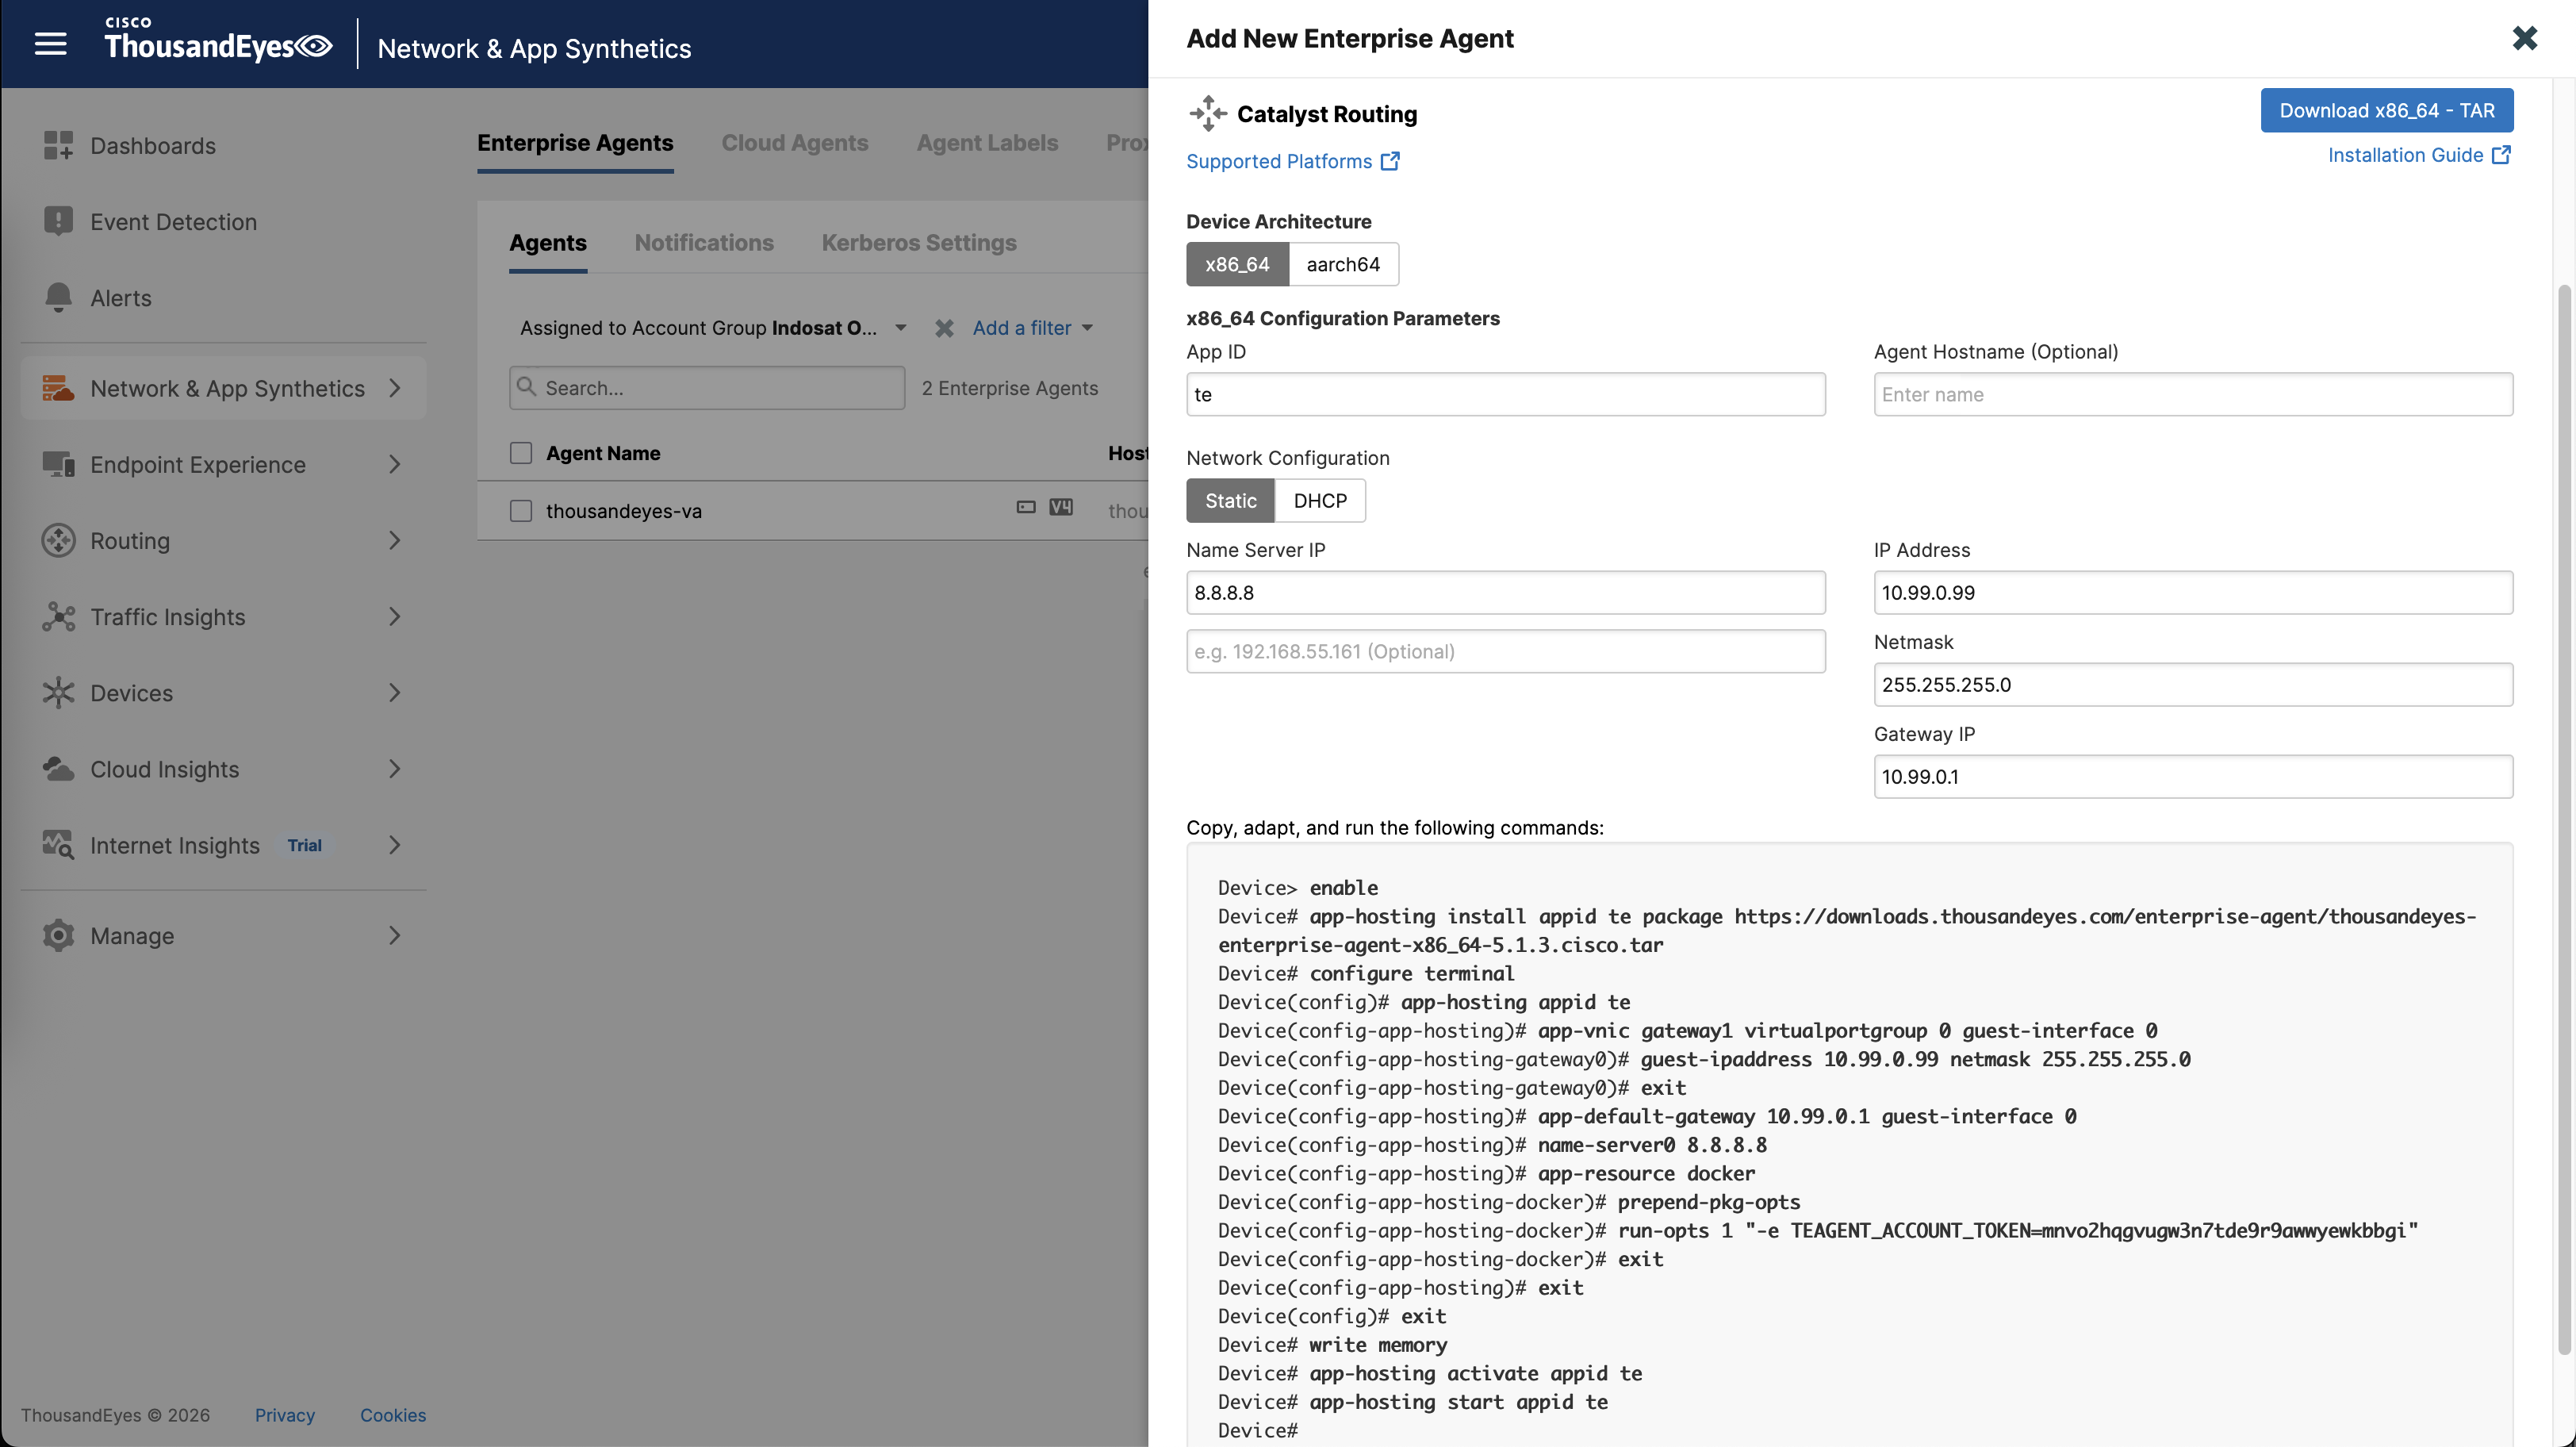
Next we will add a cisco’s built-in agent directly on the Edge Router, the agent requires its own network segment that’s being NATted so it can reach the internet
First we enable IOx and make sure the service is running
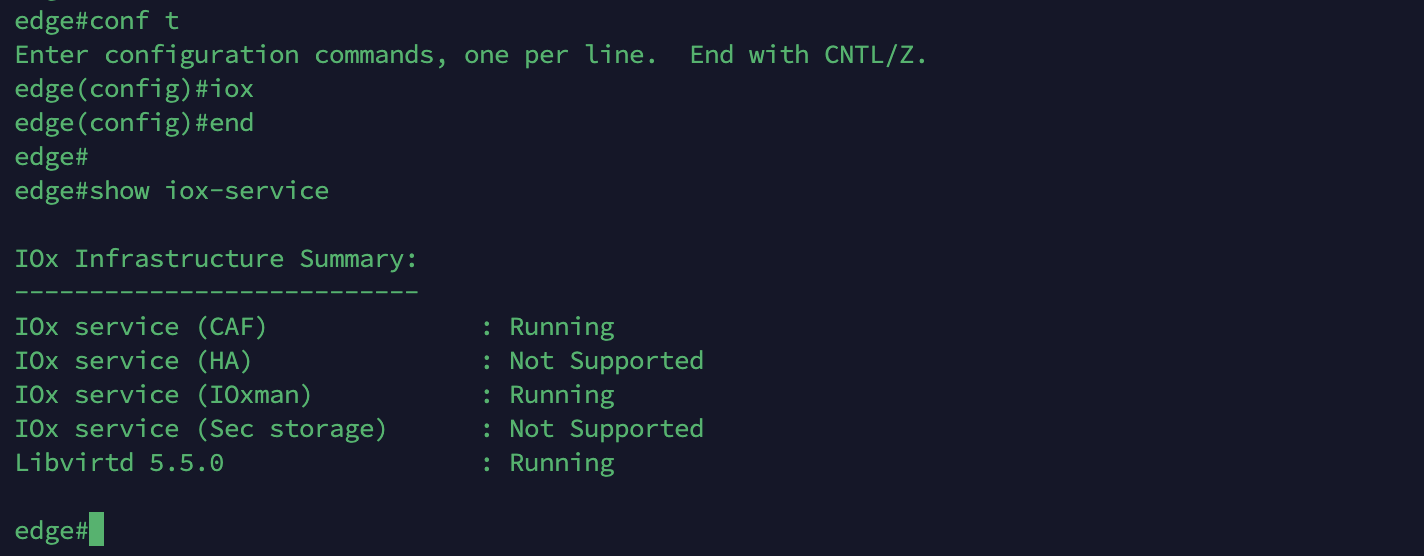
IOx is application hosting platform on the router, allowing us to run Linux apps or containers directly on router
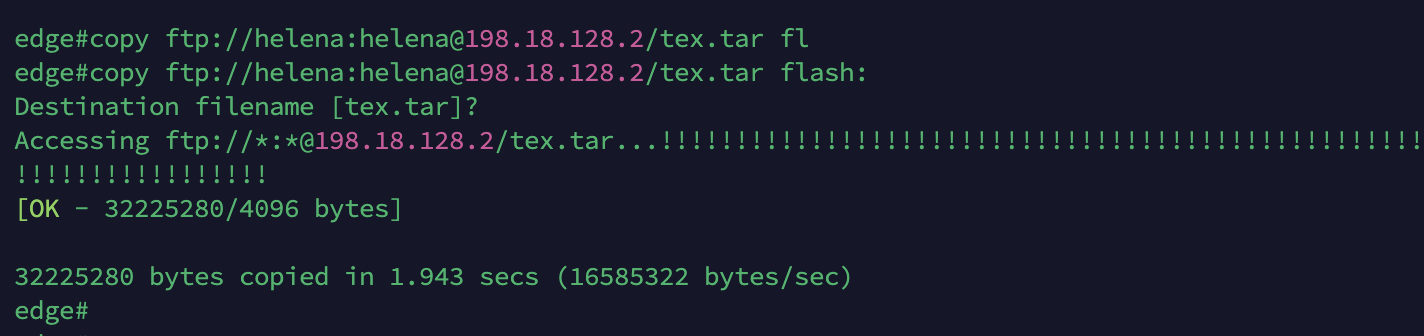
Then we download the agent and copy it over to the router
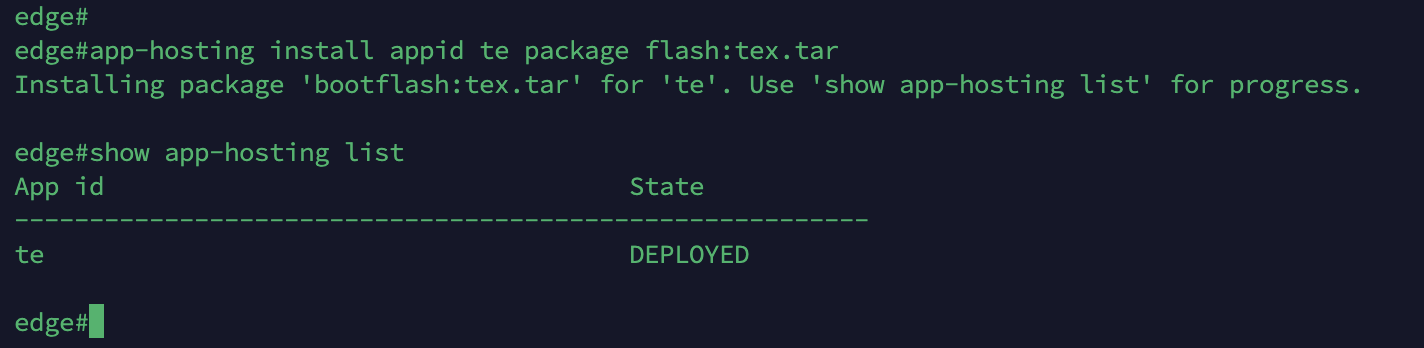
After that install the agent and ensure the state is ‘DEPLOYED’
1
2
app-hosting install appid te package flash:tex.tar
show app-hosting list
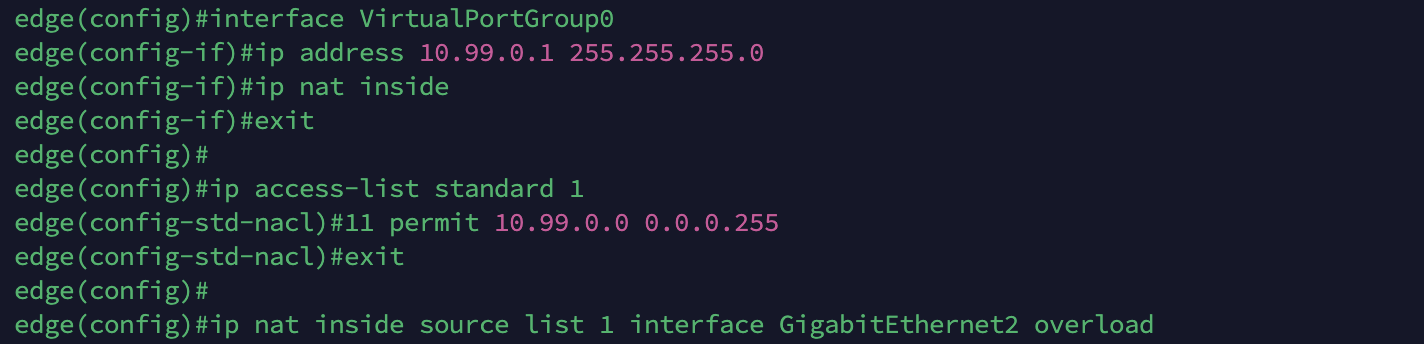
Then we configure the Virtual Interface and NAT
1
2
3
4
5
6
7
8
interface VirtualPortGroup0
ip address 10.99.0.1 255.255.255.0
ip nat inside

ip access-list standard 1
11 permit 10.99.0.0 0.0.0.255

ip nat inside source list 1 interface GigabitEthernet2 overload
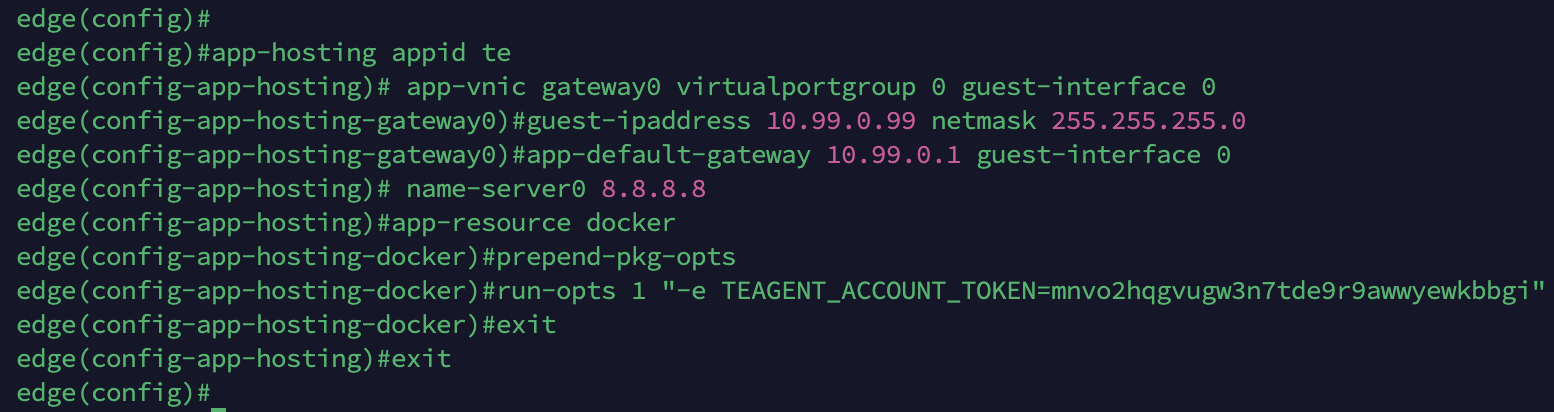
Then we configure the TE App and Docker, here we also provide the registration token
1
2
3
4
5
6
7
8
app-hosting appid te
 app-vnic gateway0 virtualportgroup 0 guest-interface 0
  guest-ipaddress 10.99.0.99 netmask 255.255.255.0
  app-default-gateway 10.99.0.1 guest-interface 0
 name-server0 8.8.8.8
 app-resource docker
  prepend-pkg-opts
  run-opts 1 "-e TEAGENT_ACCOUNT_TOKEN=mnvo2hqgvugw3n7tde9r9awwyewkbbgi"
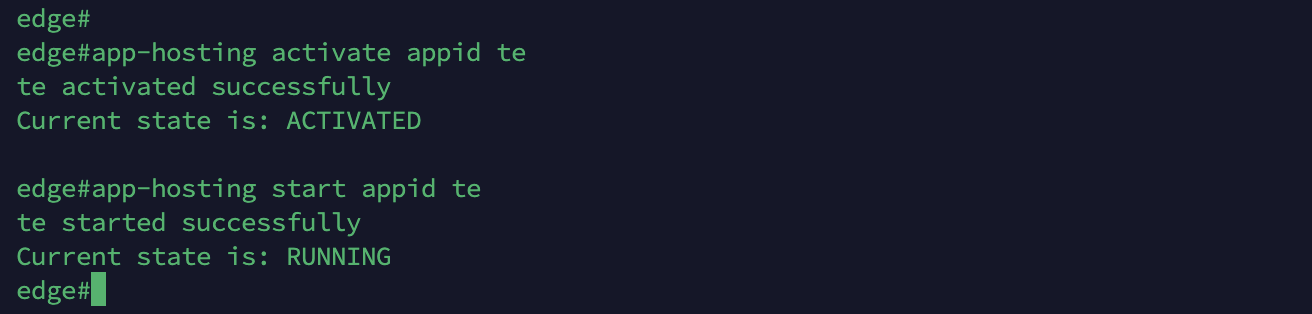
Finally we can activate and start the TE App
1
2
app-hosting activate appid te
app-hosting start appid te
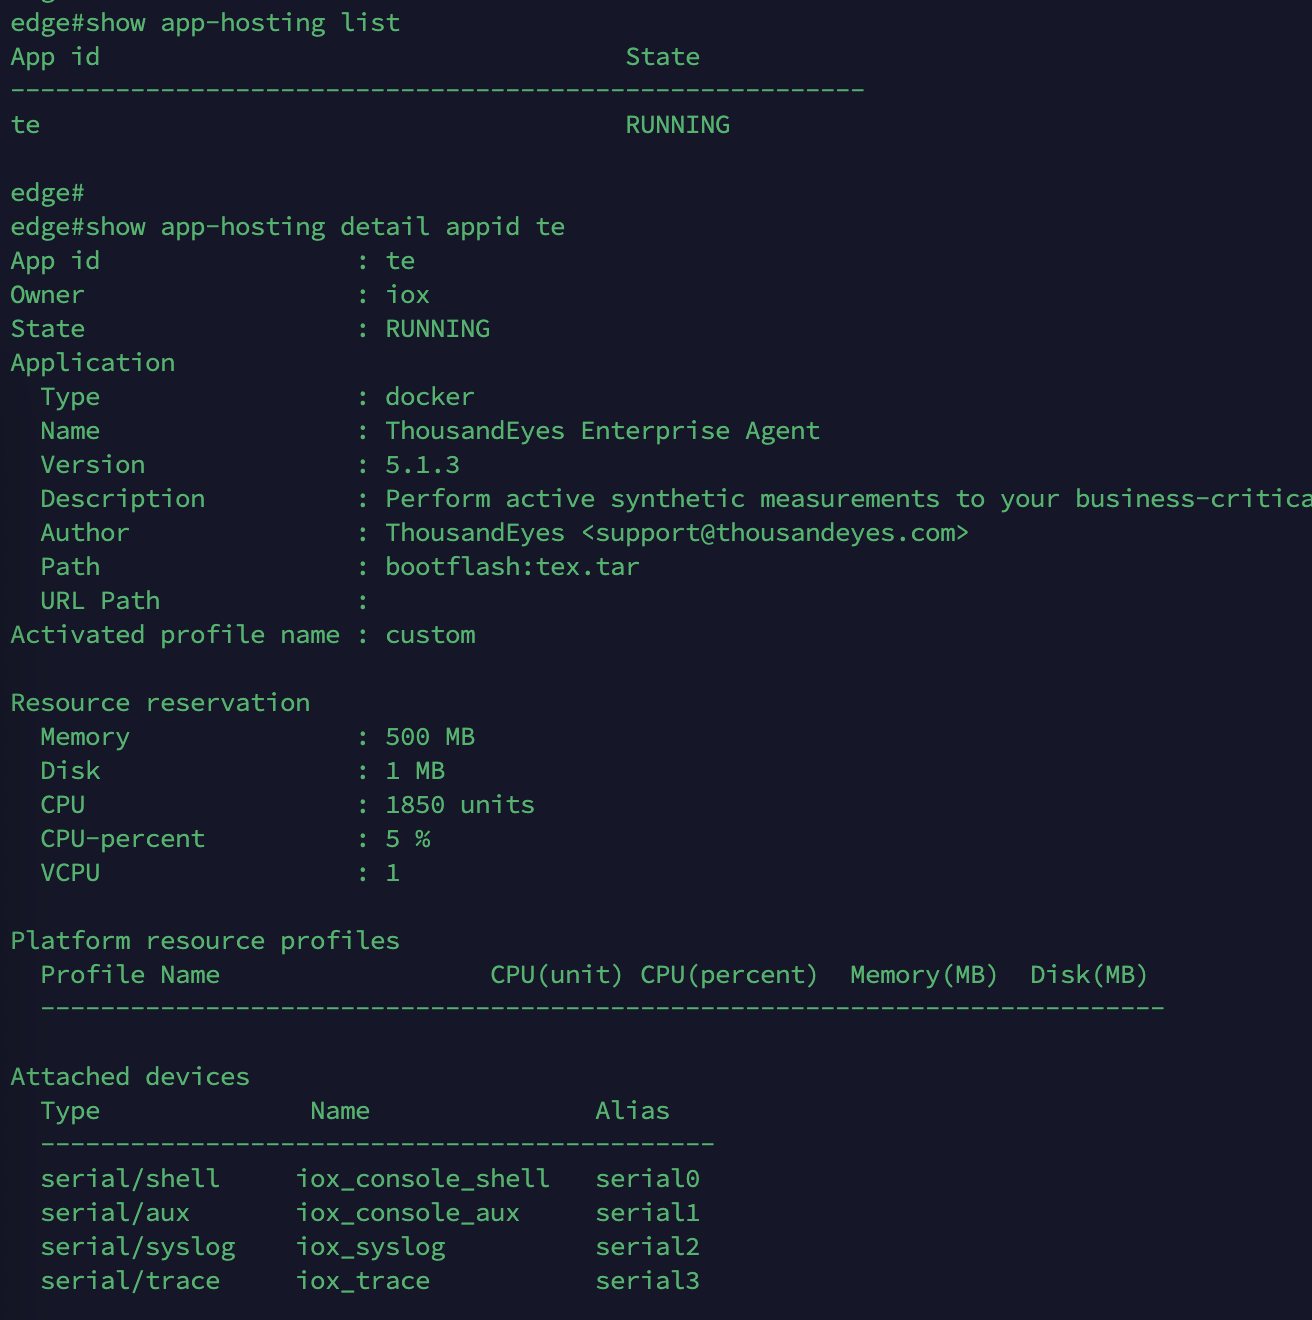
Verify the app is up and running
1
2
show app-hosting list
show app-hosting detail appid te
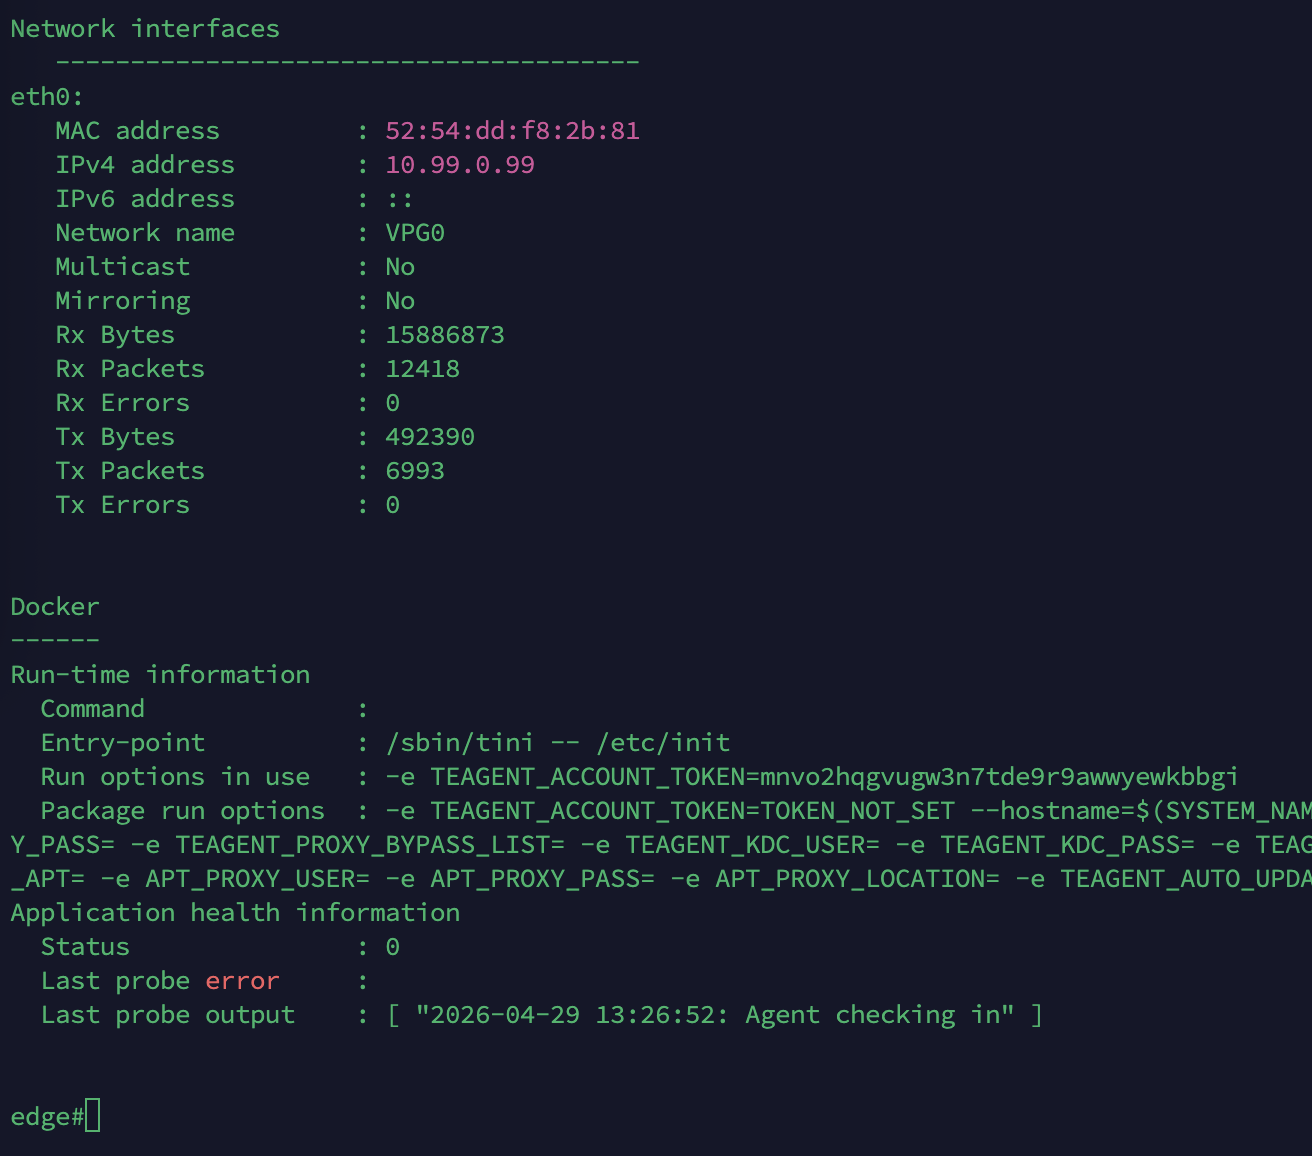
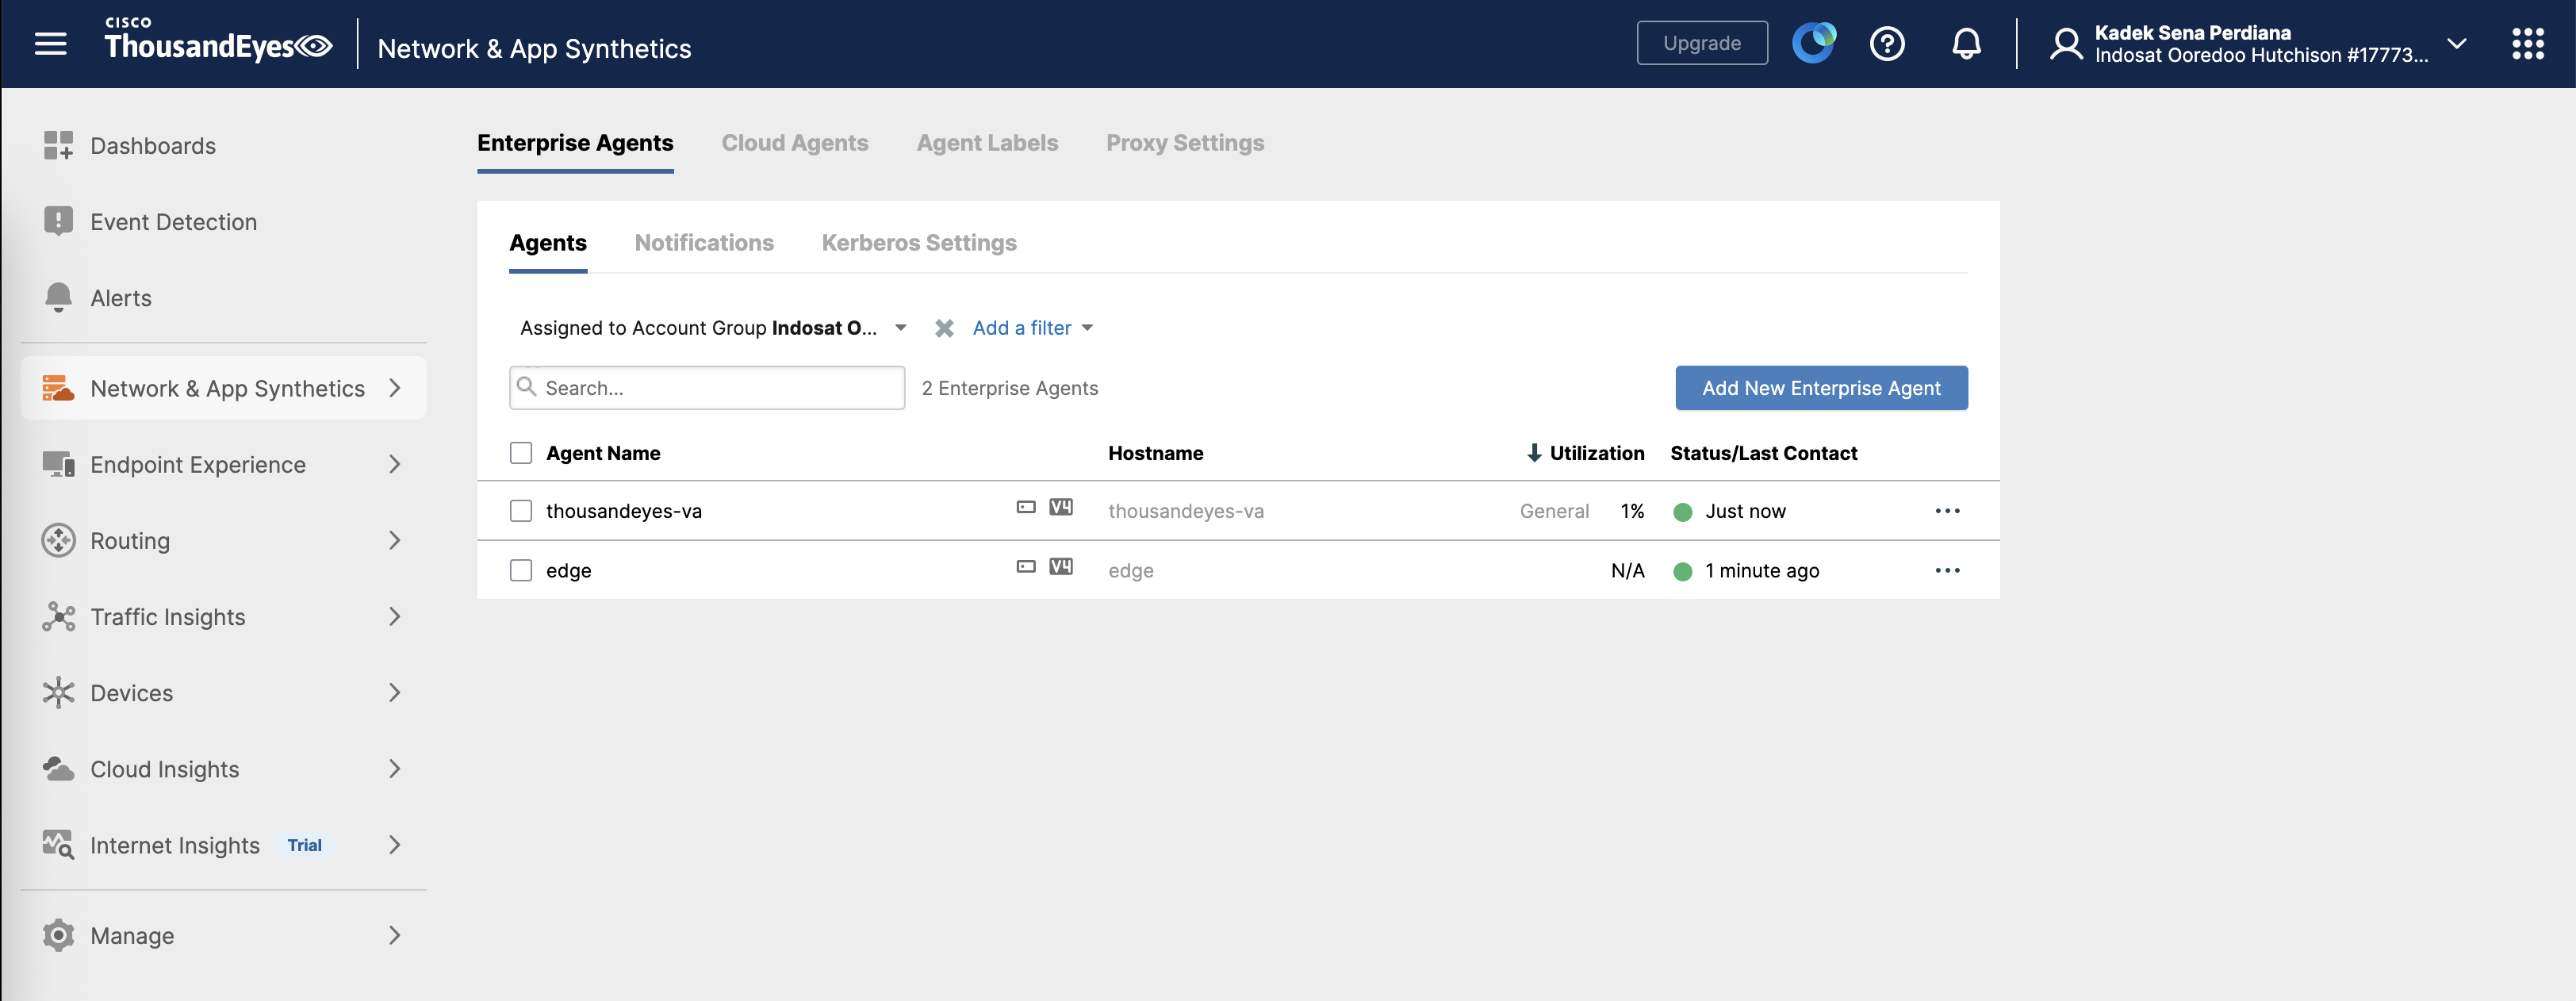
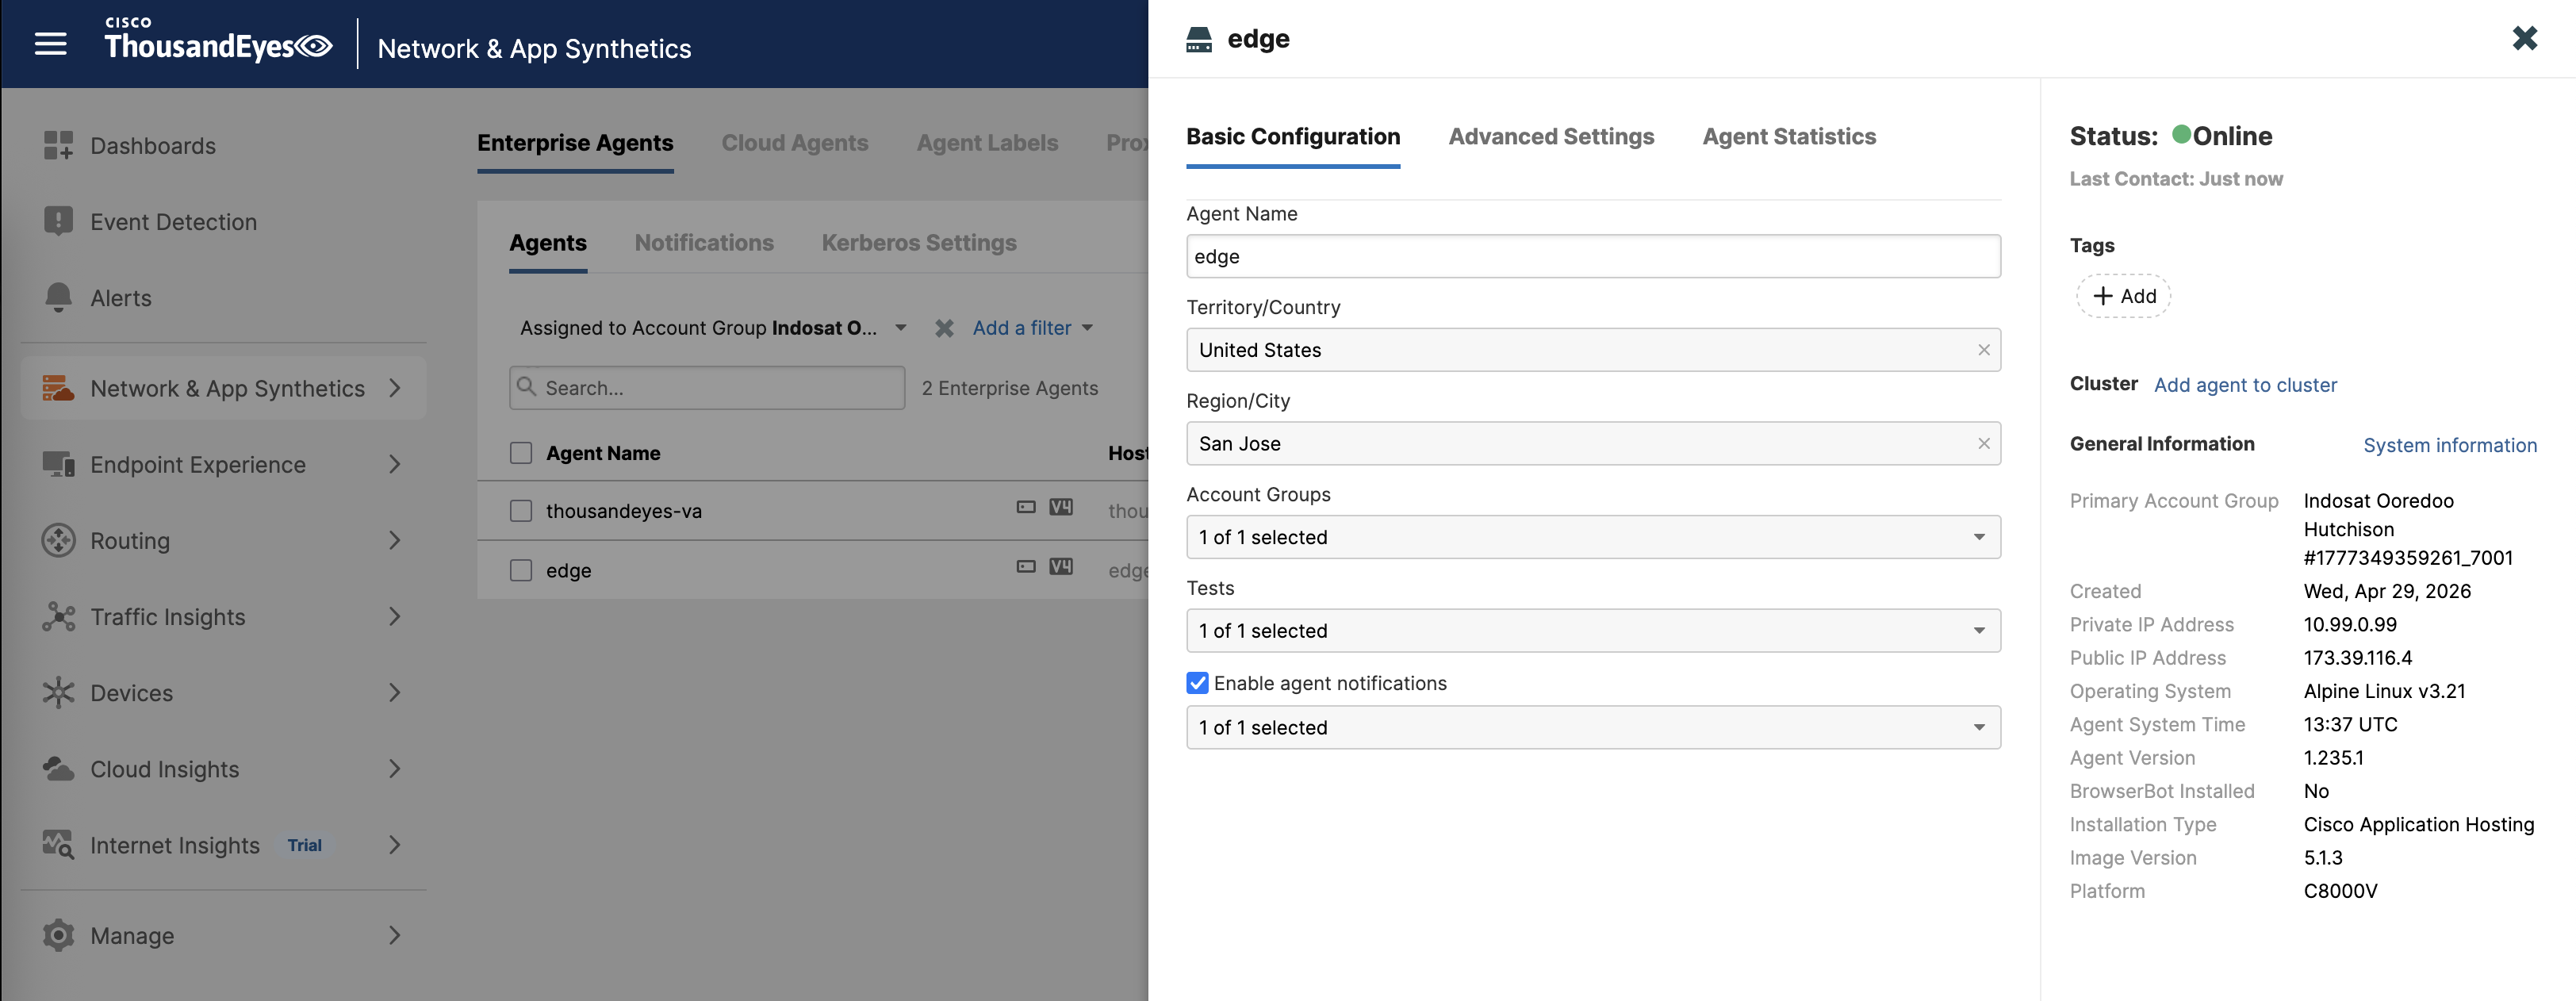
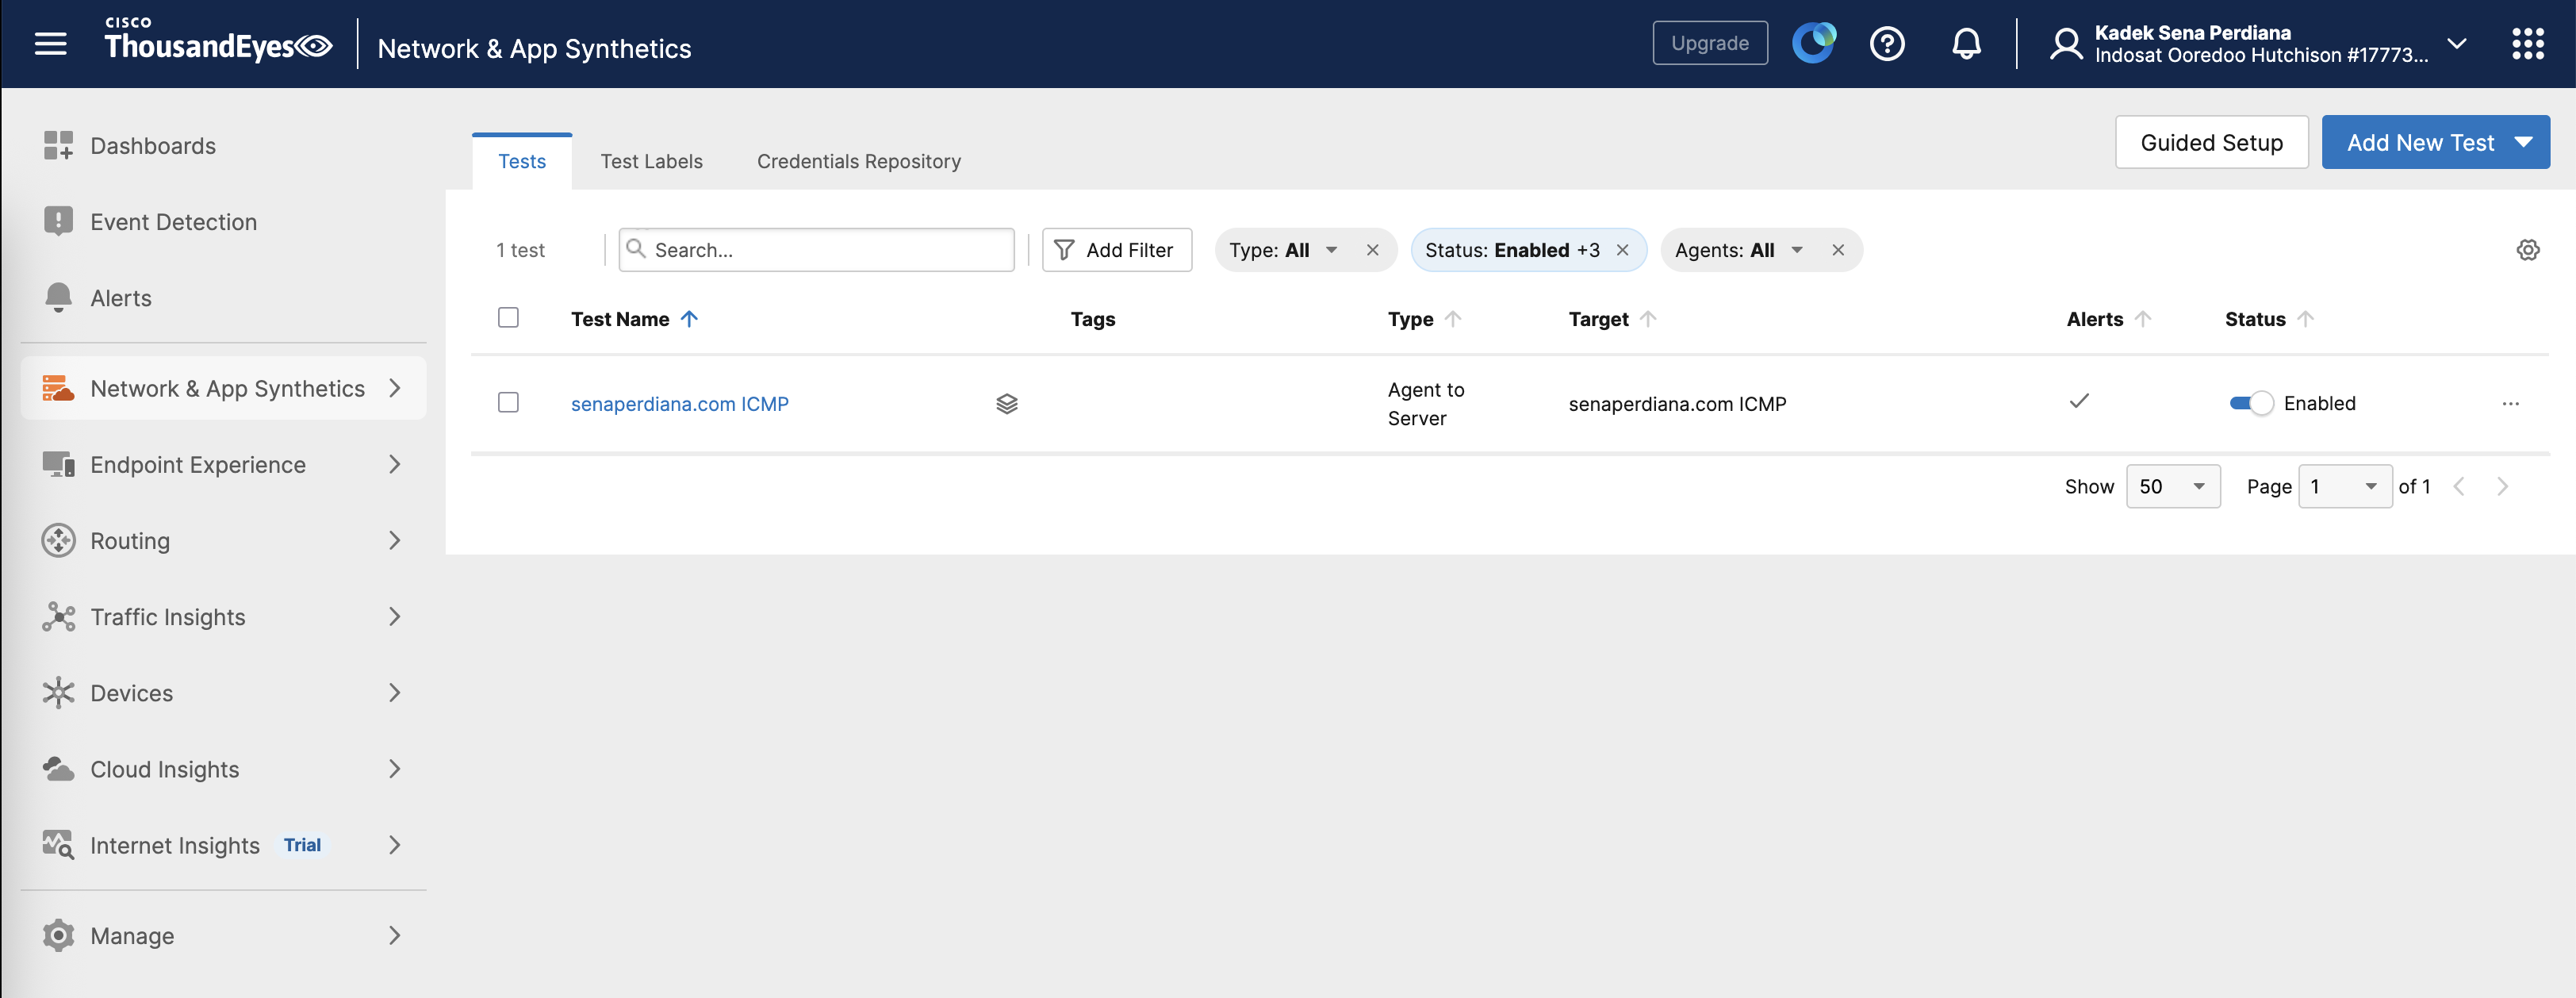
Back to the TE Portal, we can see now the Edge Router is registered
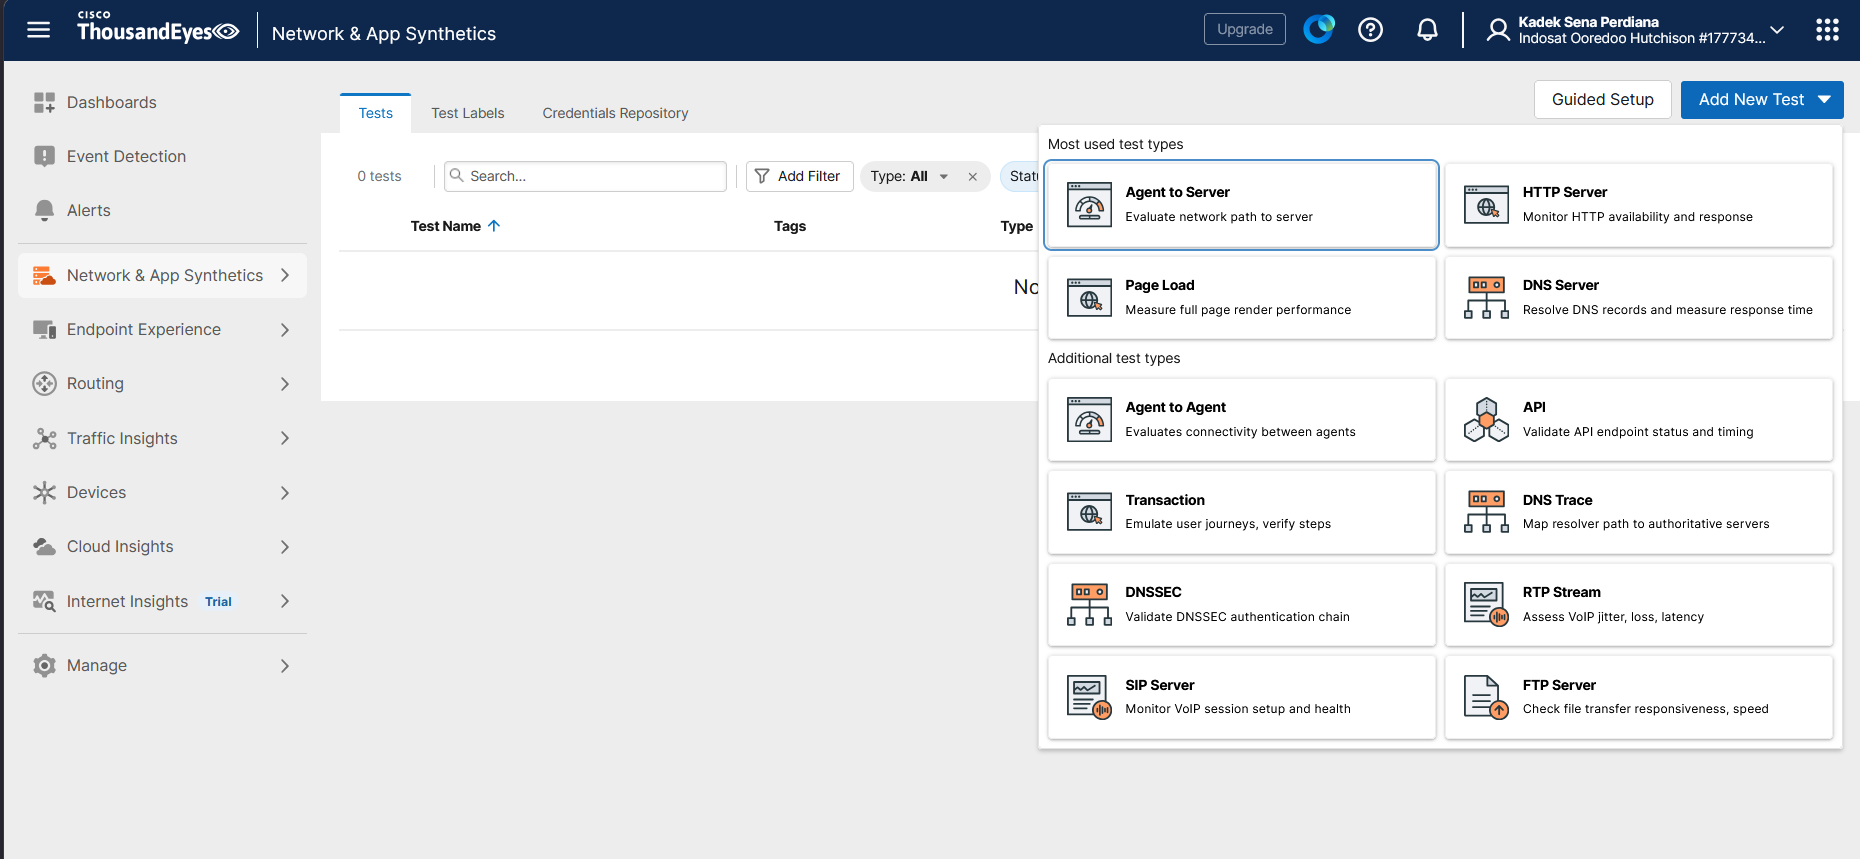
Creating Testing
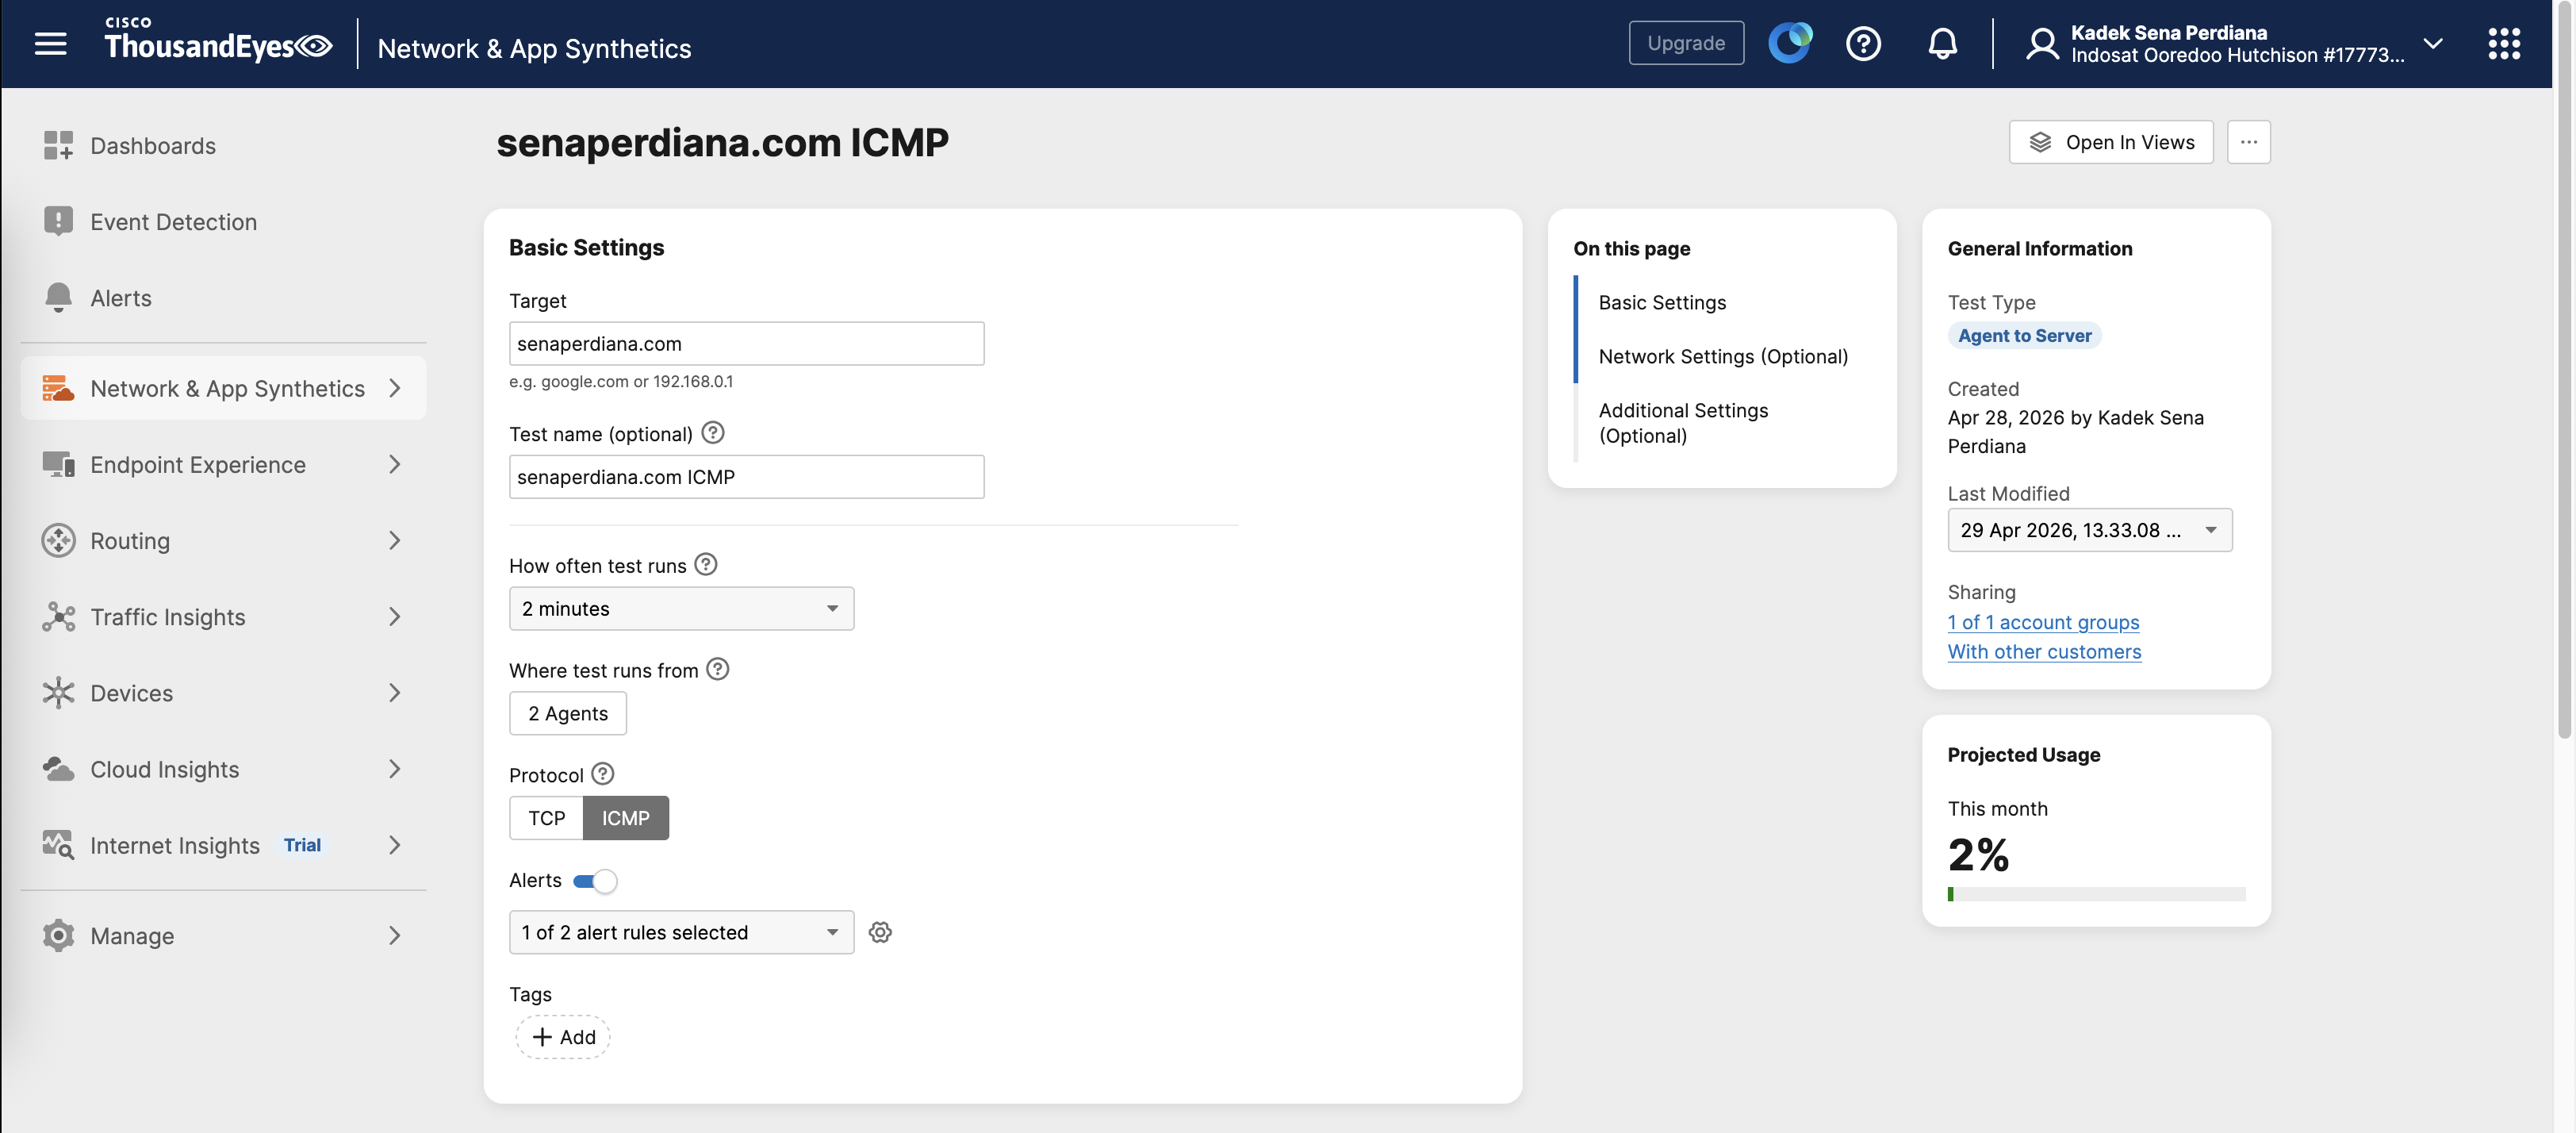
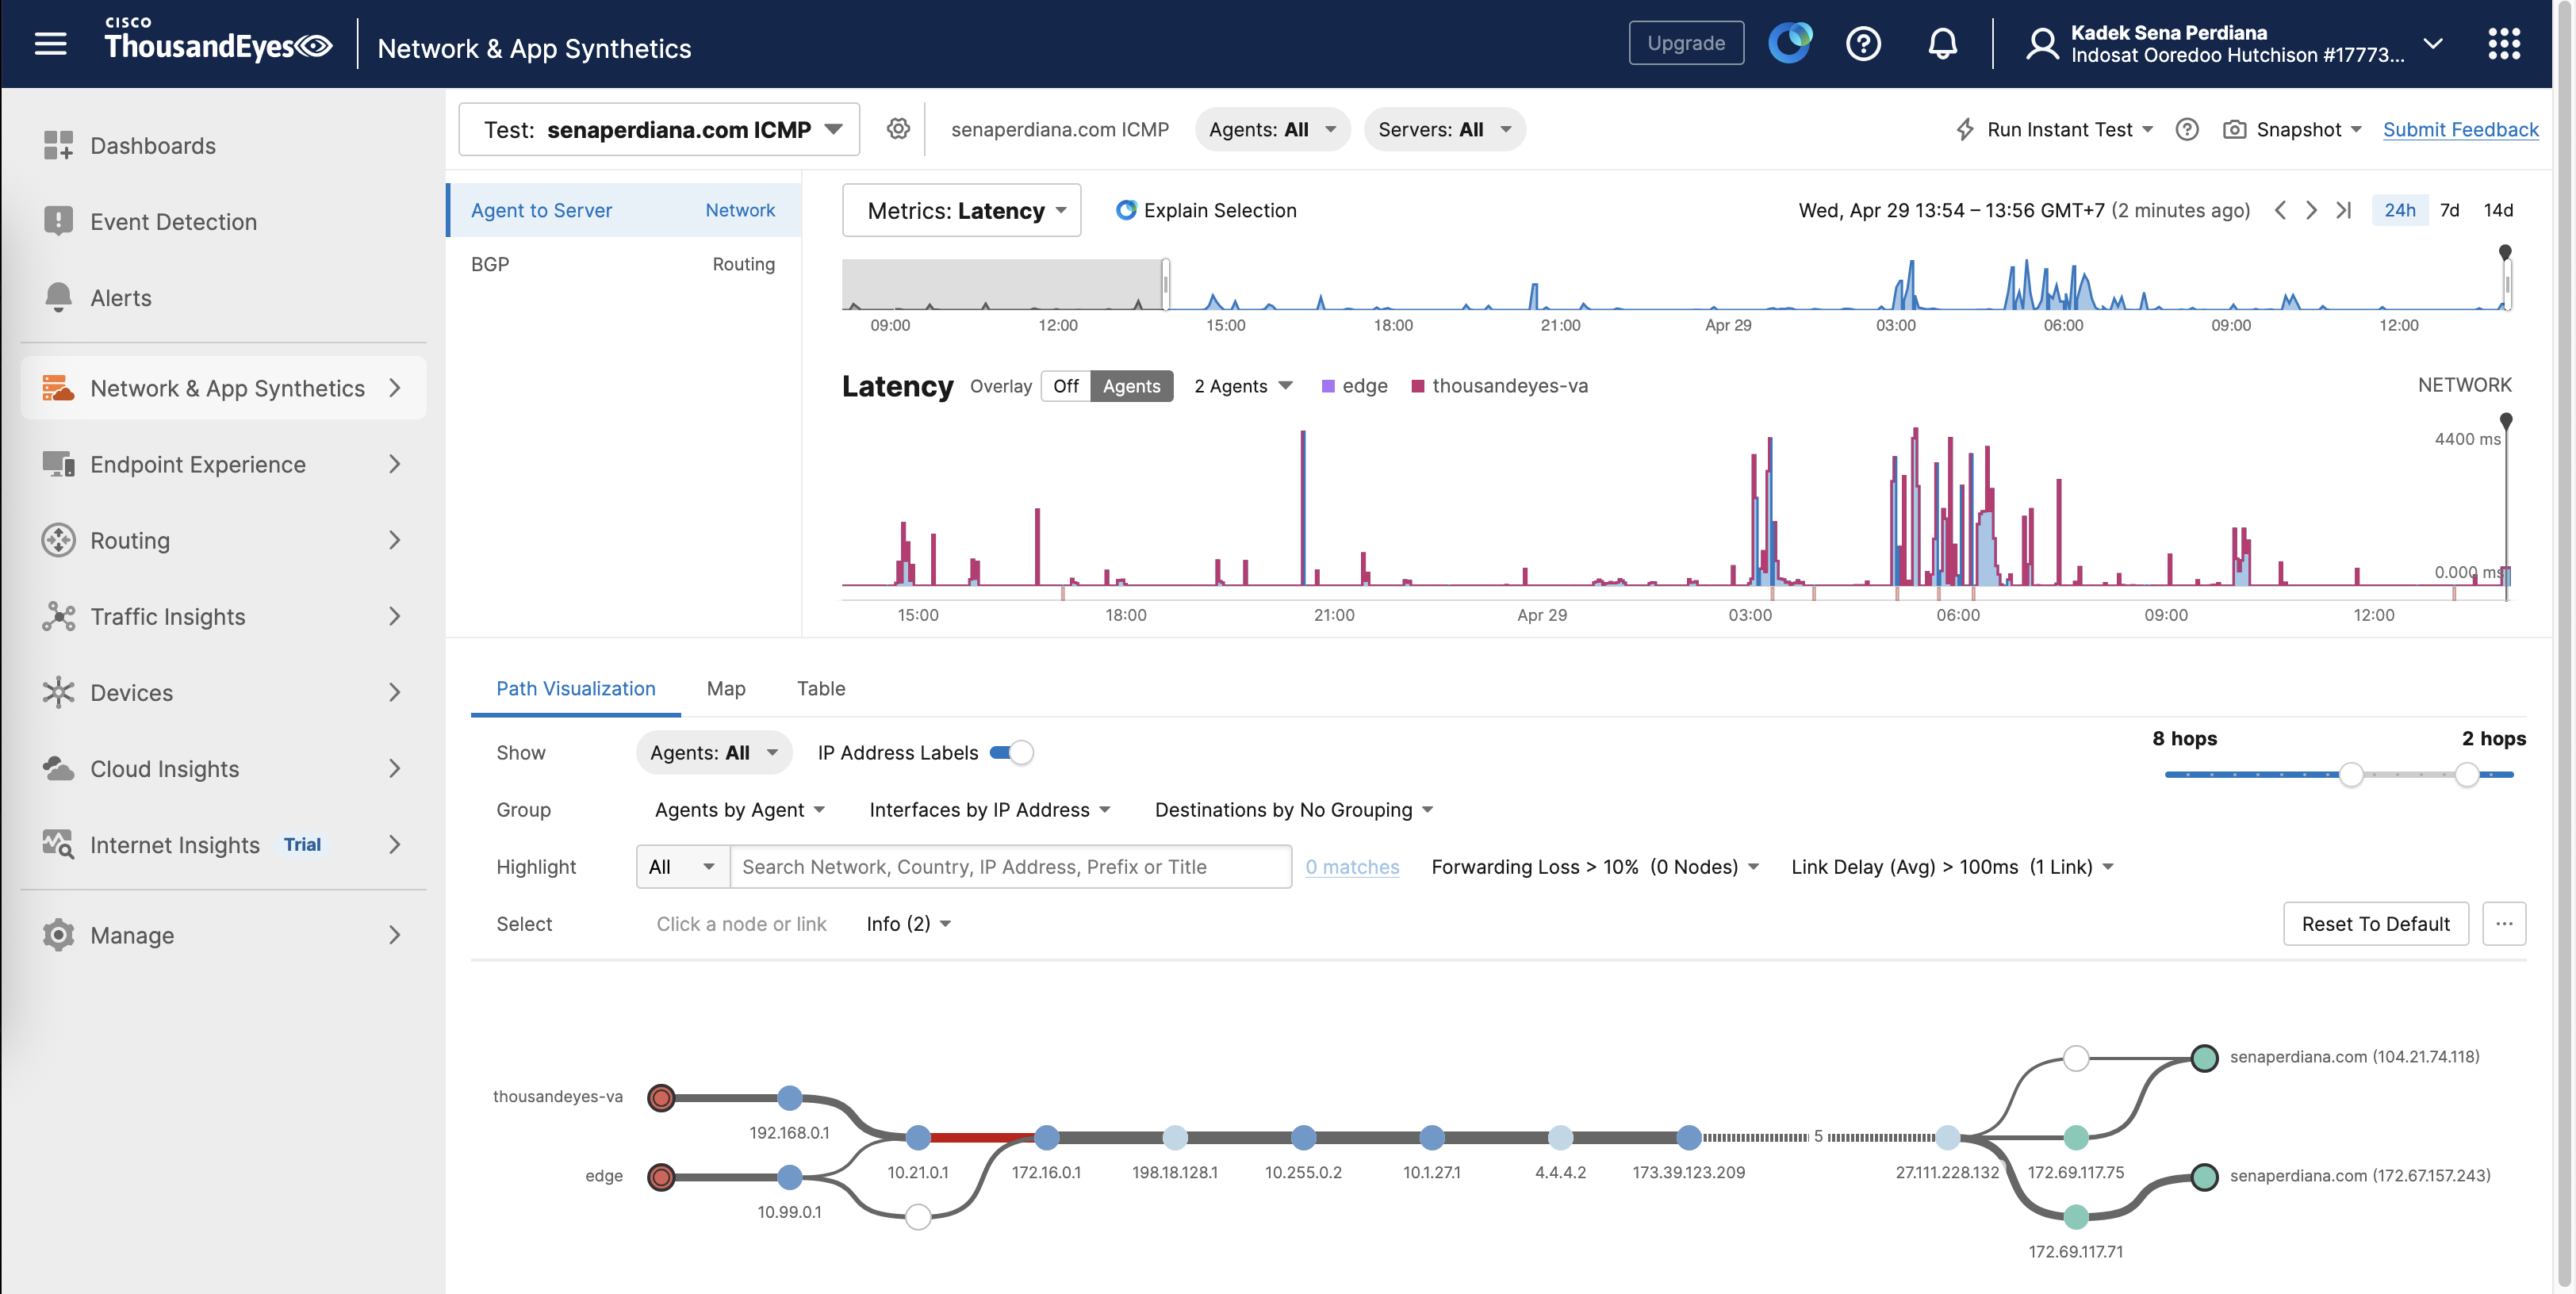
Now that we have our agents running, we can start creating test cases. We will use the Agent to Server test to evaluate our network health to the specified server, which is senaperdiana.com
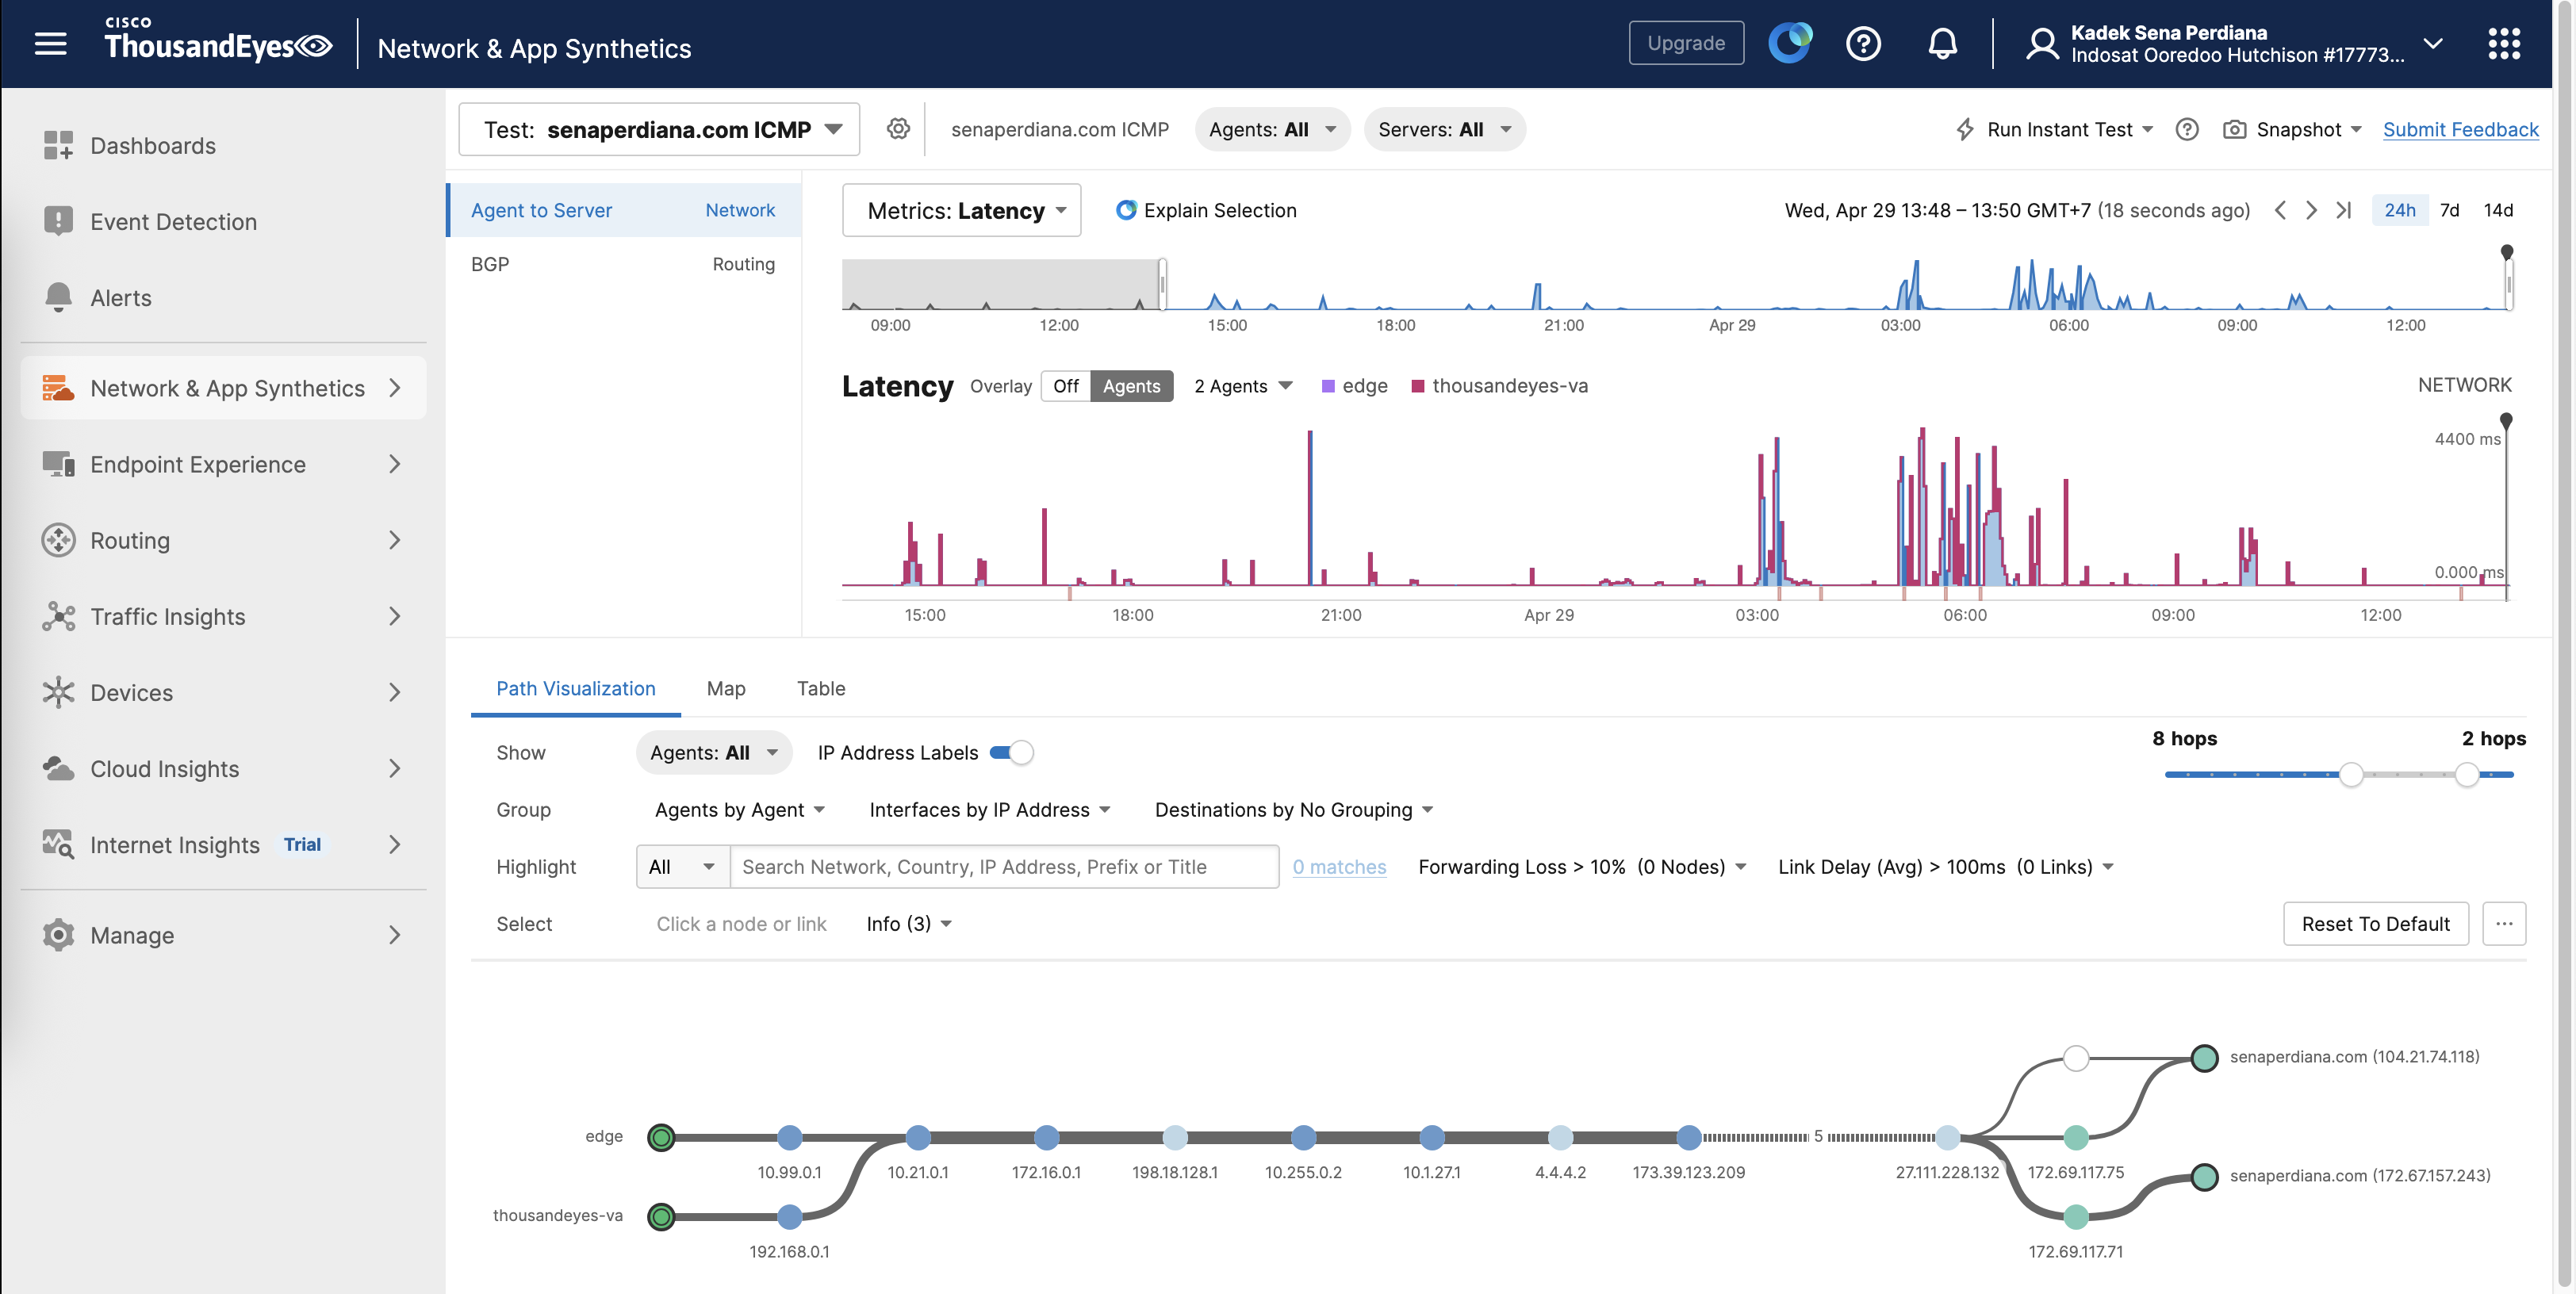
After leaving it running for some time, we can see that we’re now getting data for network latency as well as path visualization, giving as exact detail of where the latency is actually taking place
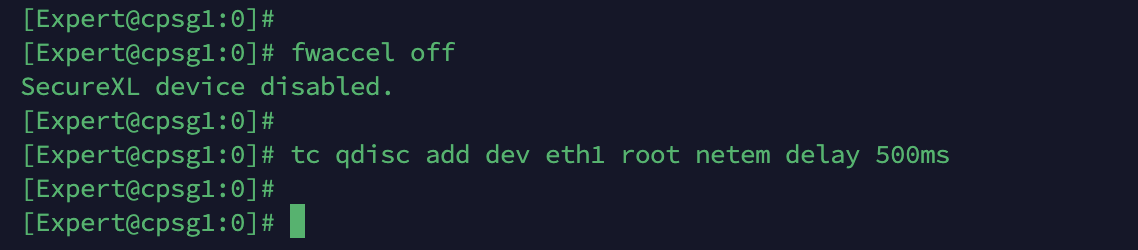
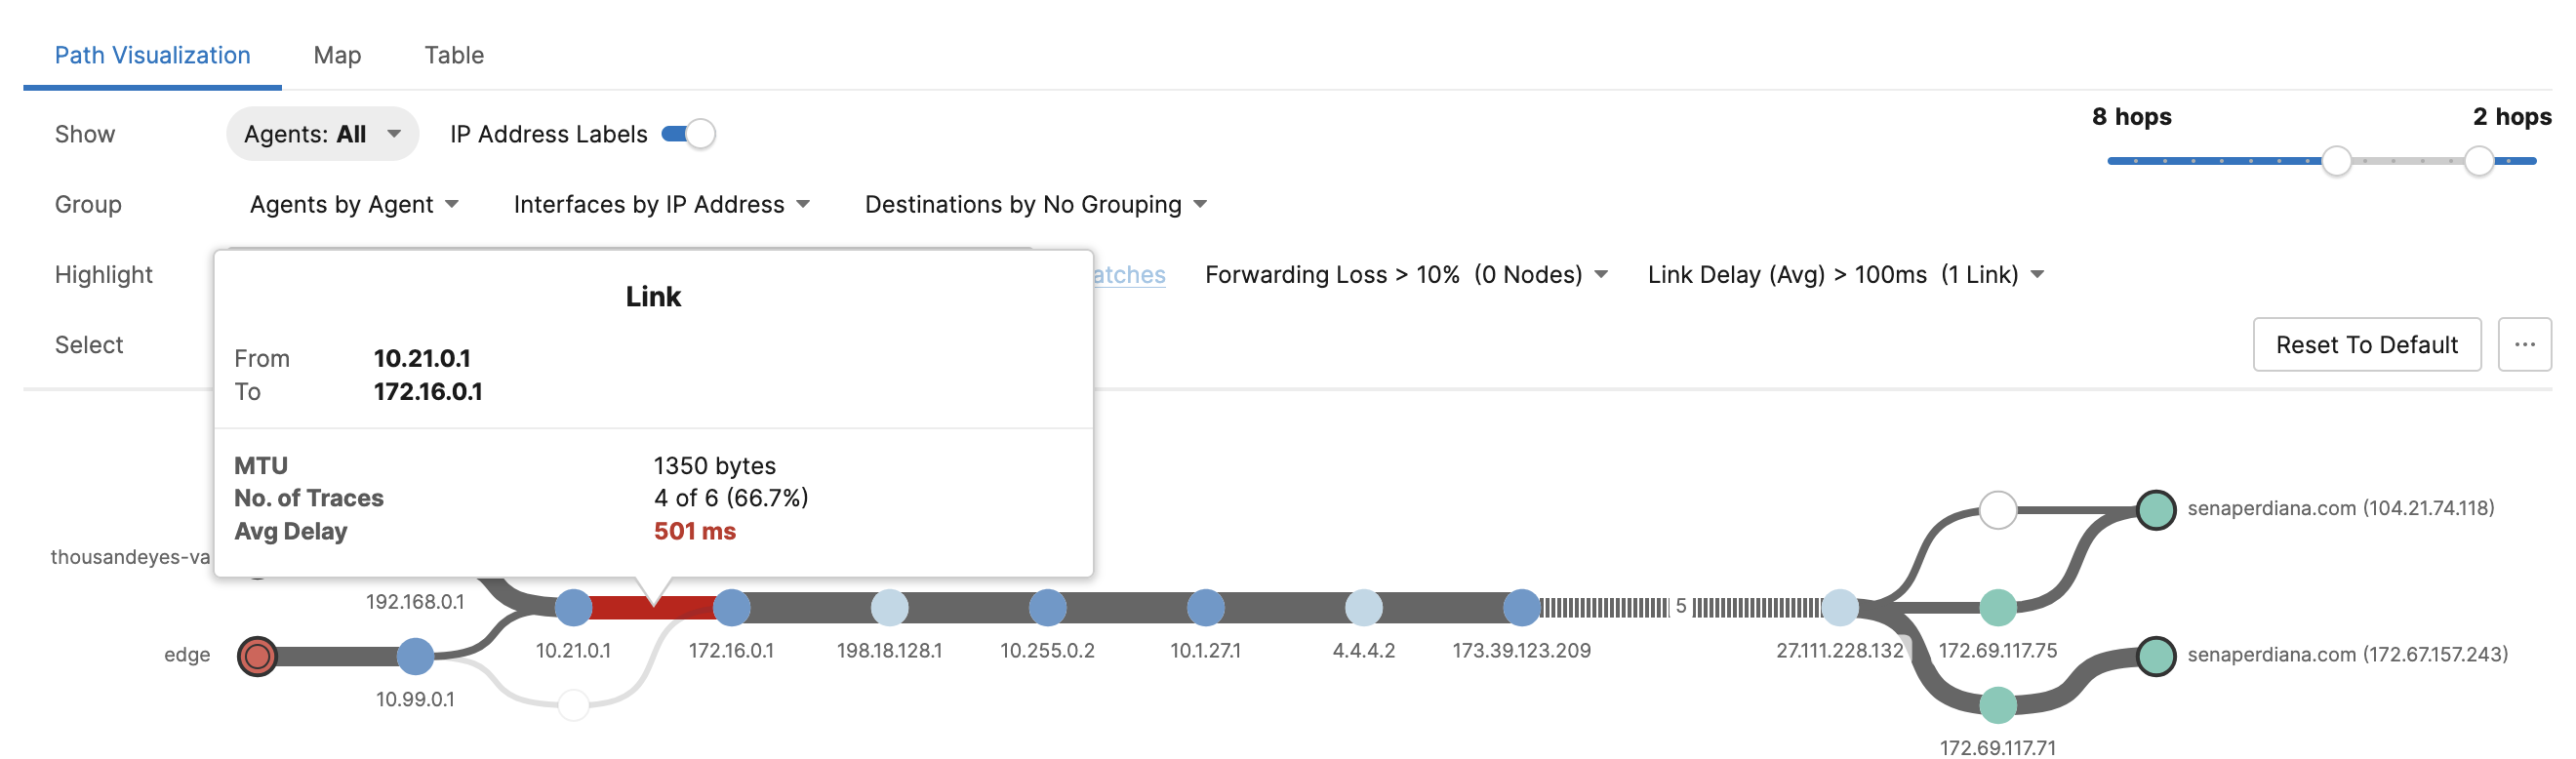
Here we will simulate a network latency on our Check Point firewall, by disabling acceleration and adding 500ms on its egress interface
1
2
fwaccel off
tc qdisc add dev eth1 root netem delay 500ms
And on TE, the exact point where the network went bad will be shown as red
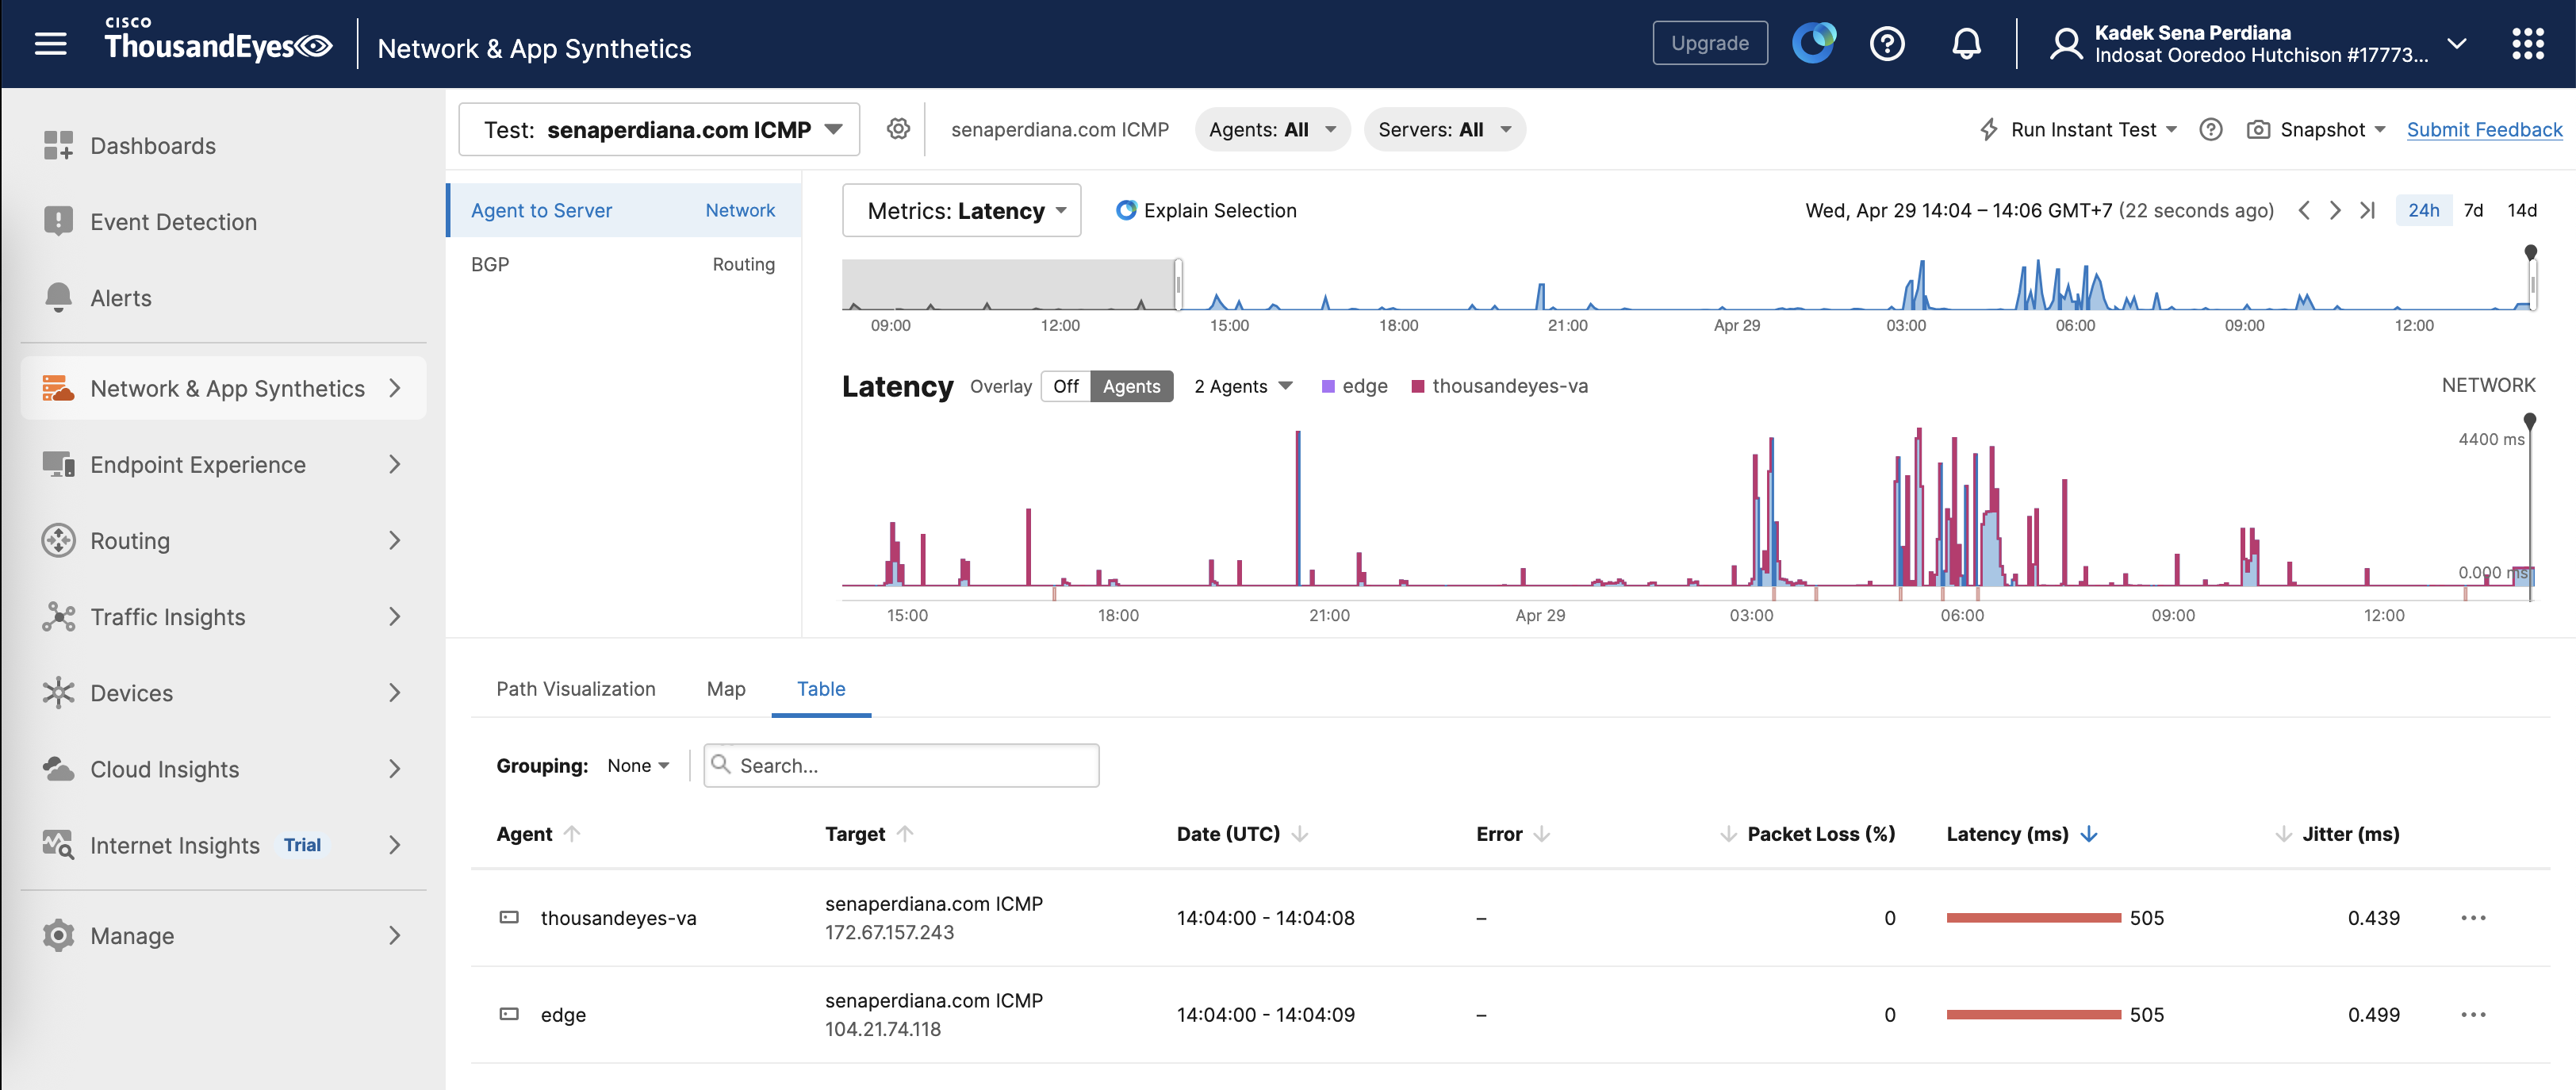
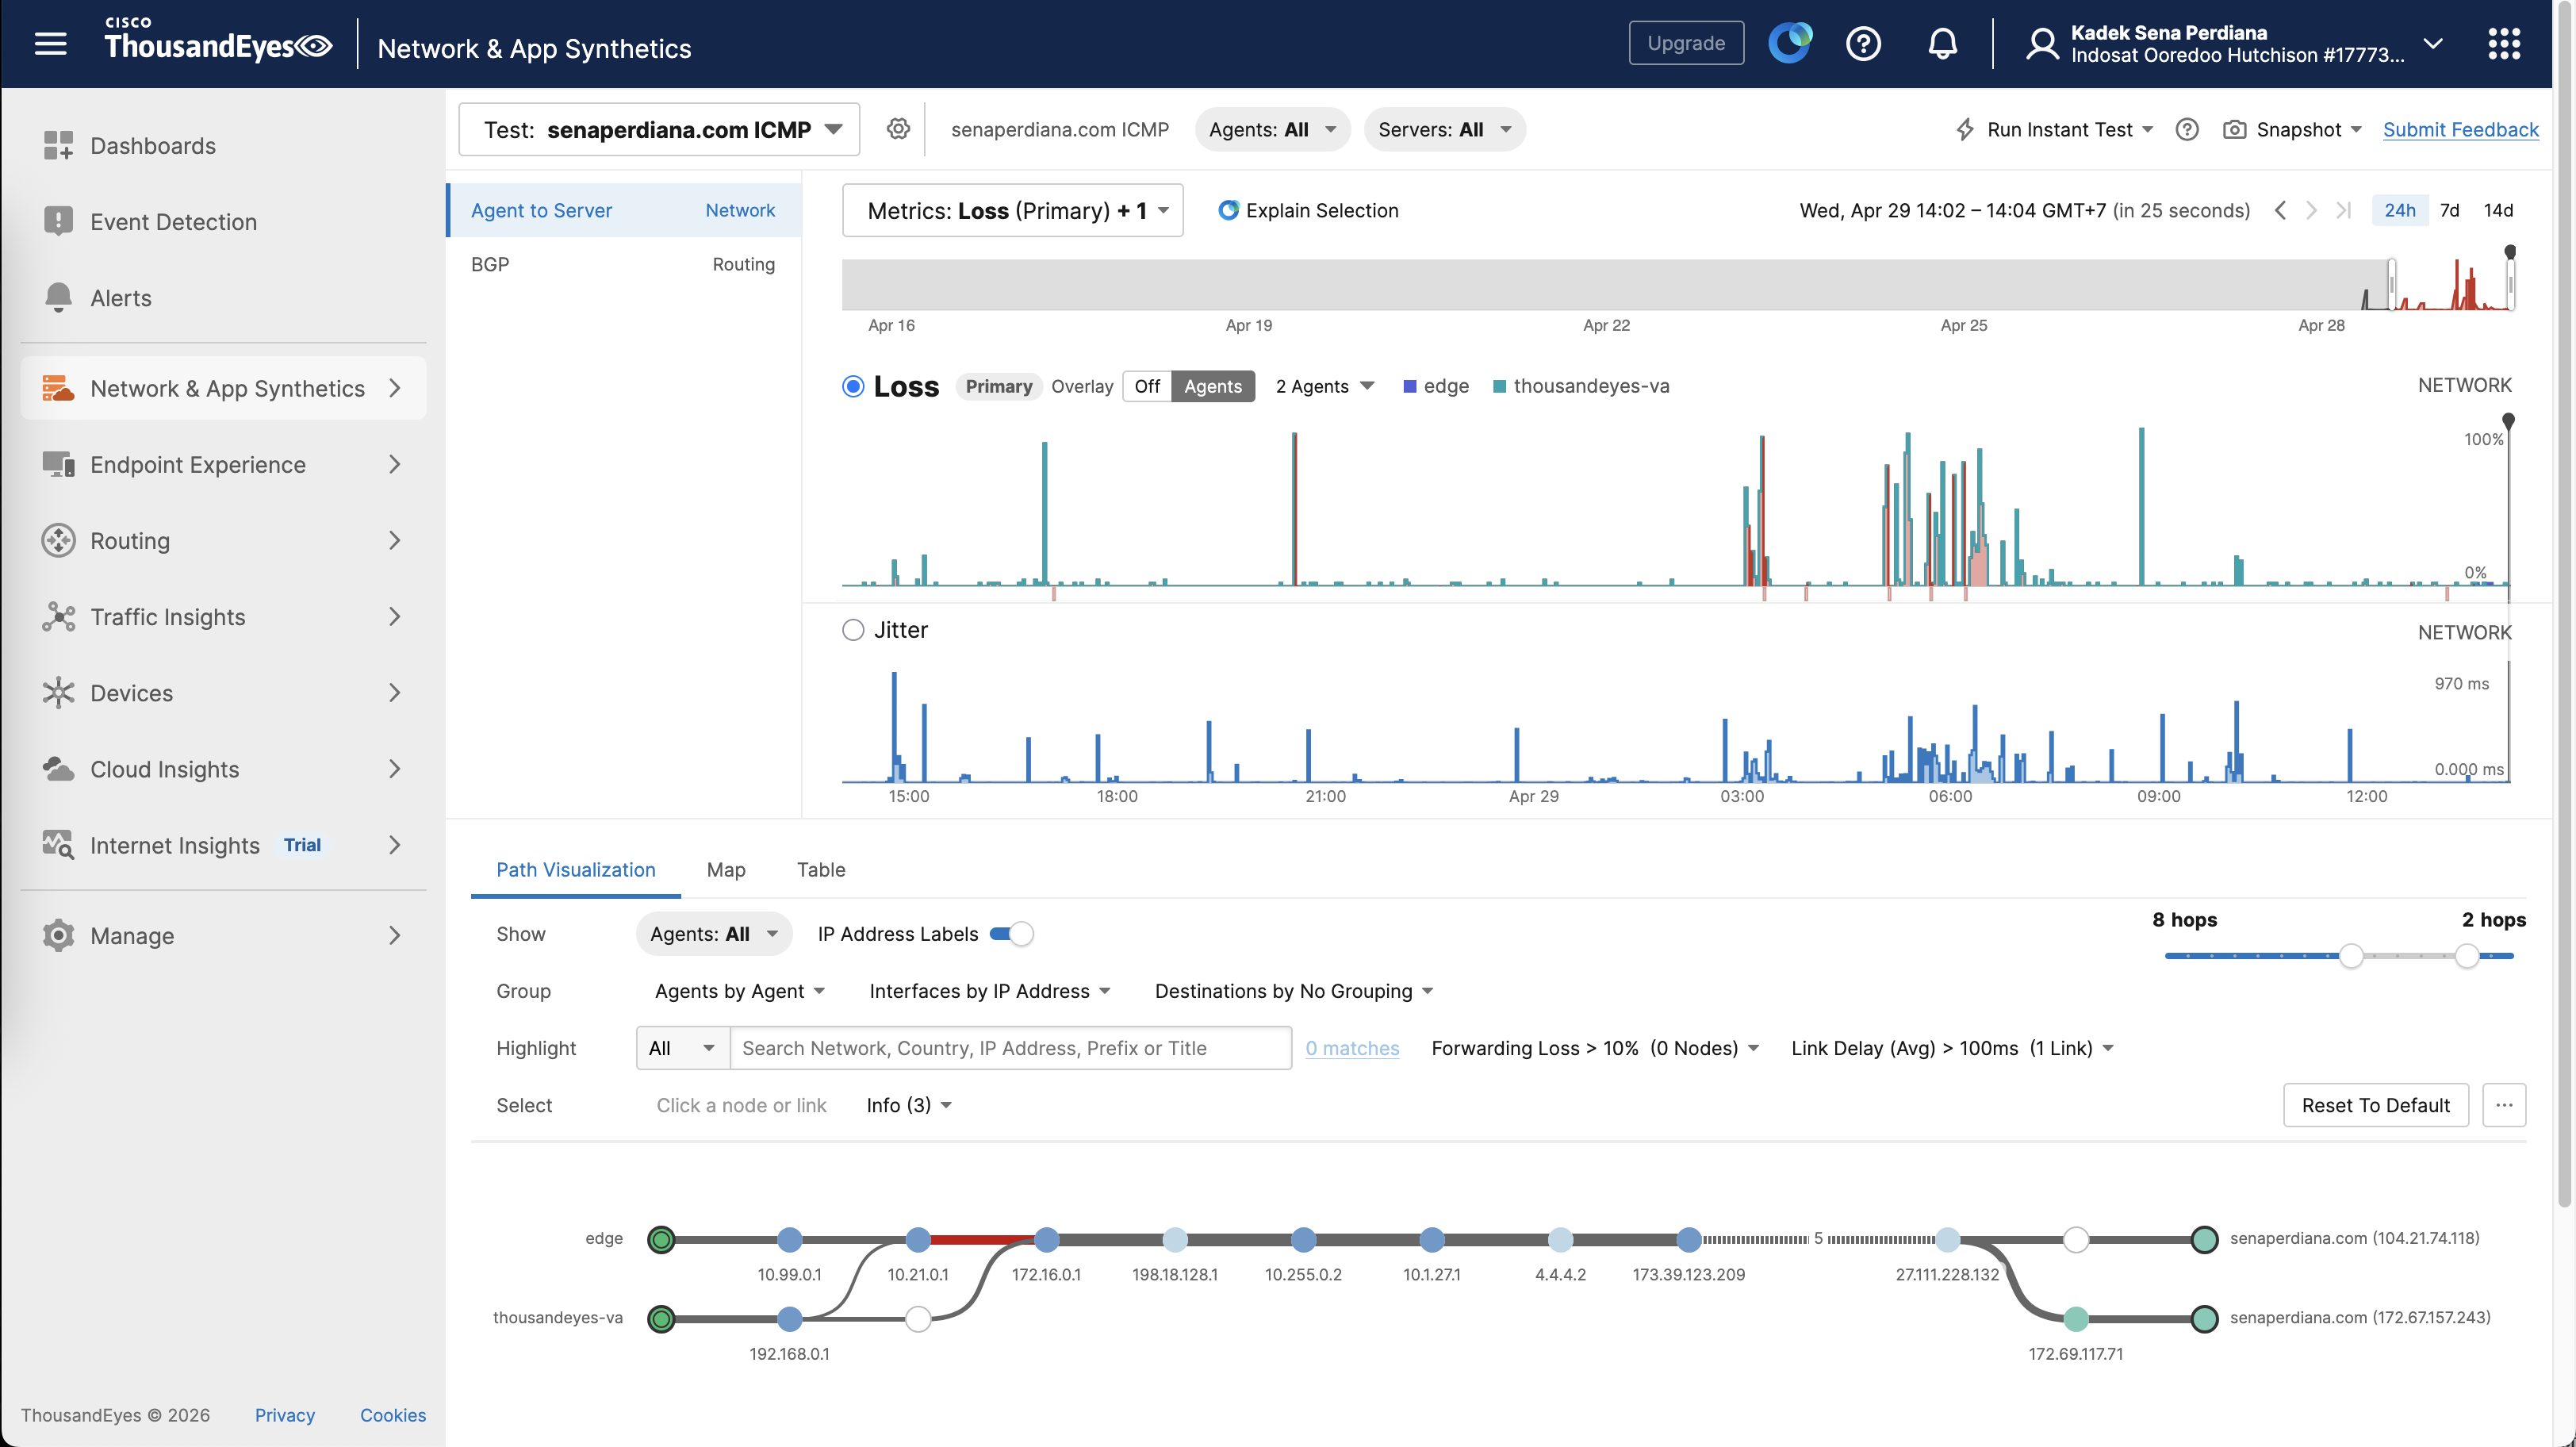
Other than latency, we can also see packet loss, jitter, and some more
Endpoint Experience
Other than Enterprise Agent, we also have Endpoint Agent where it monitors performance directly from the user’s device (like a laptop or desktop) using a lightweight background agent.
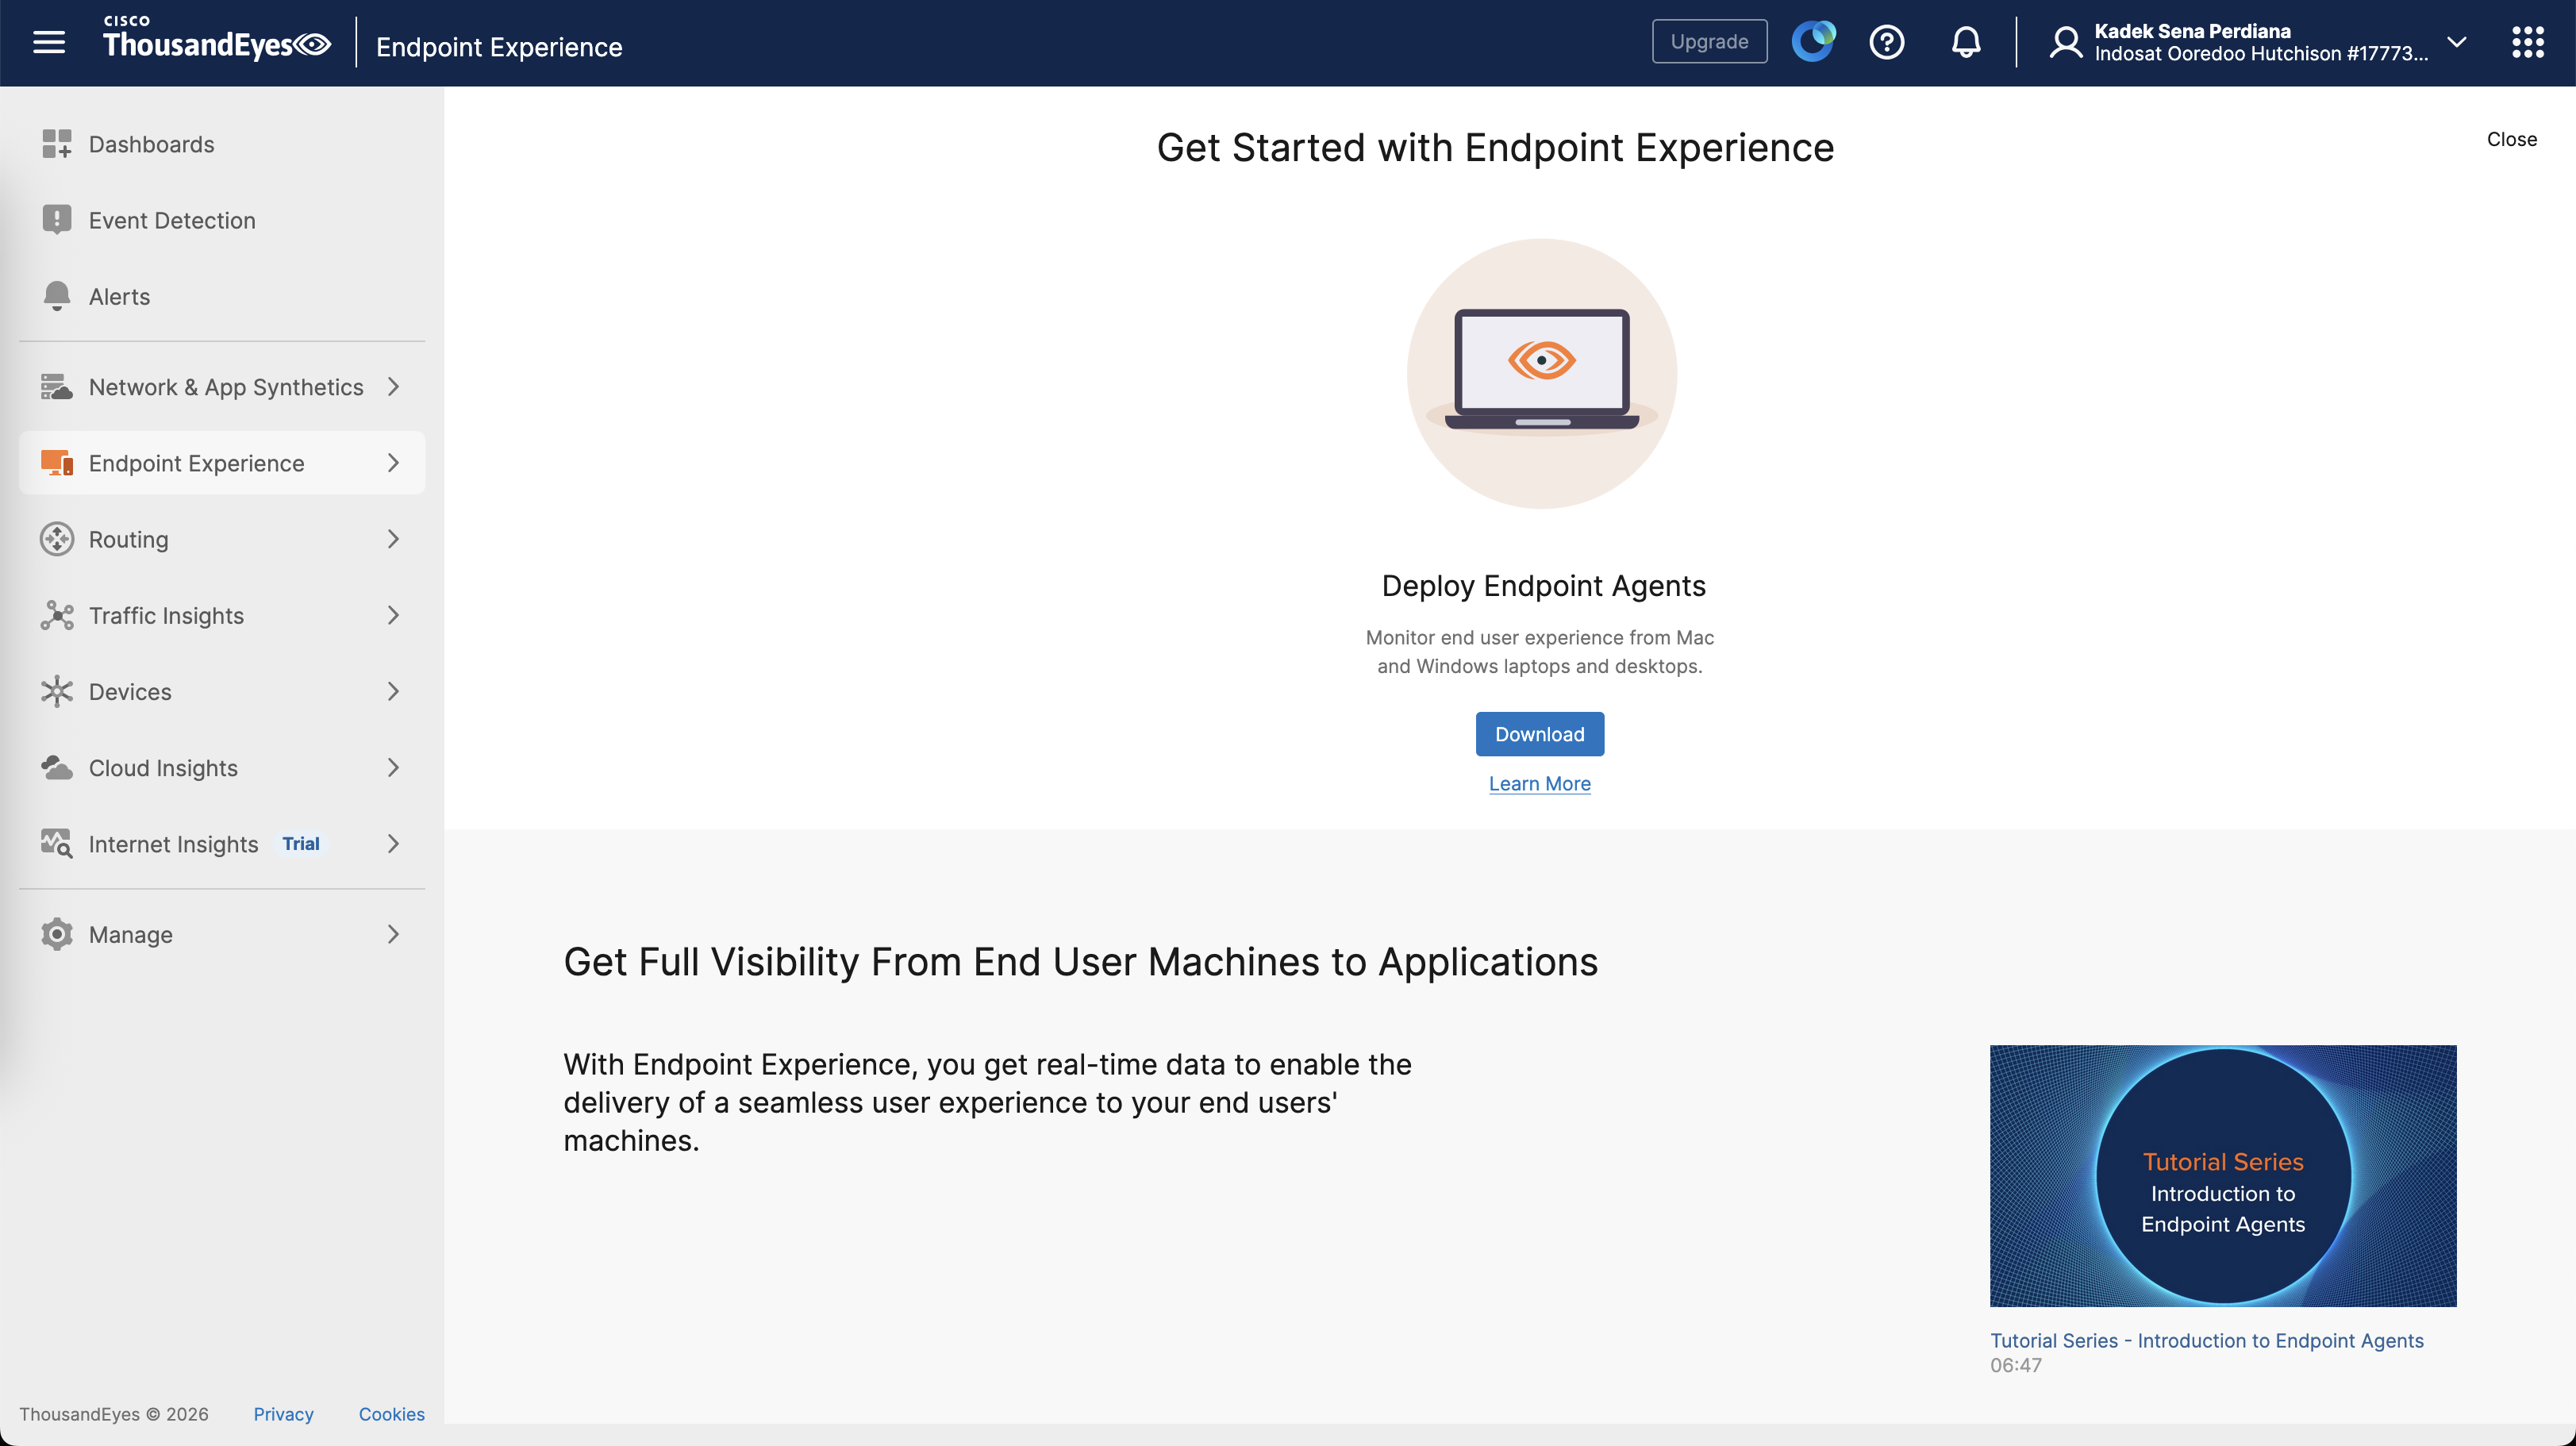
First we download the agent
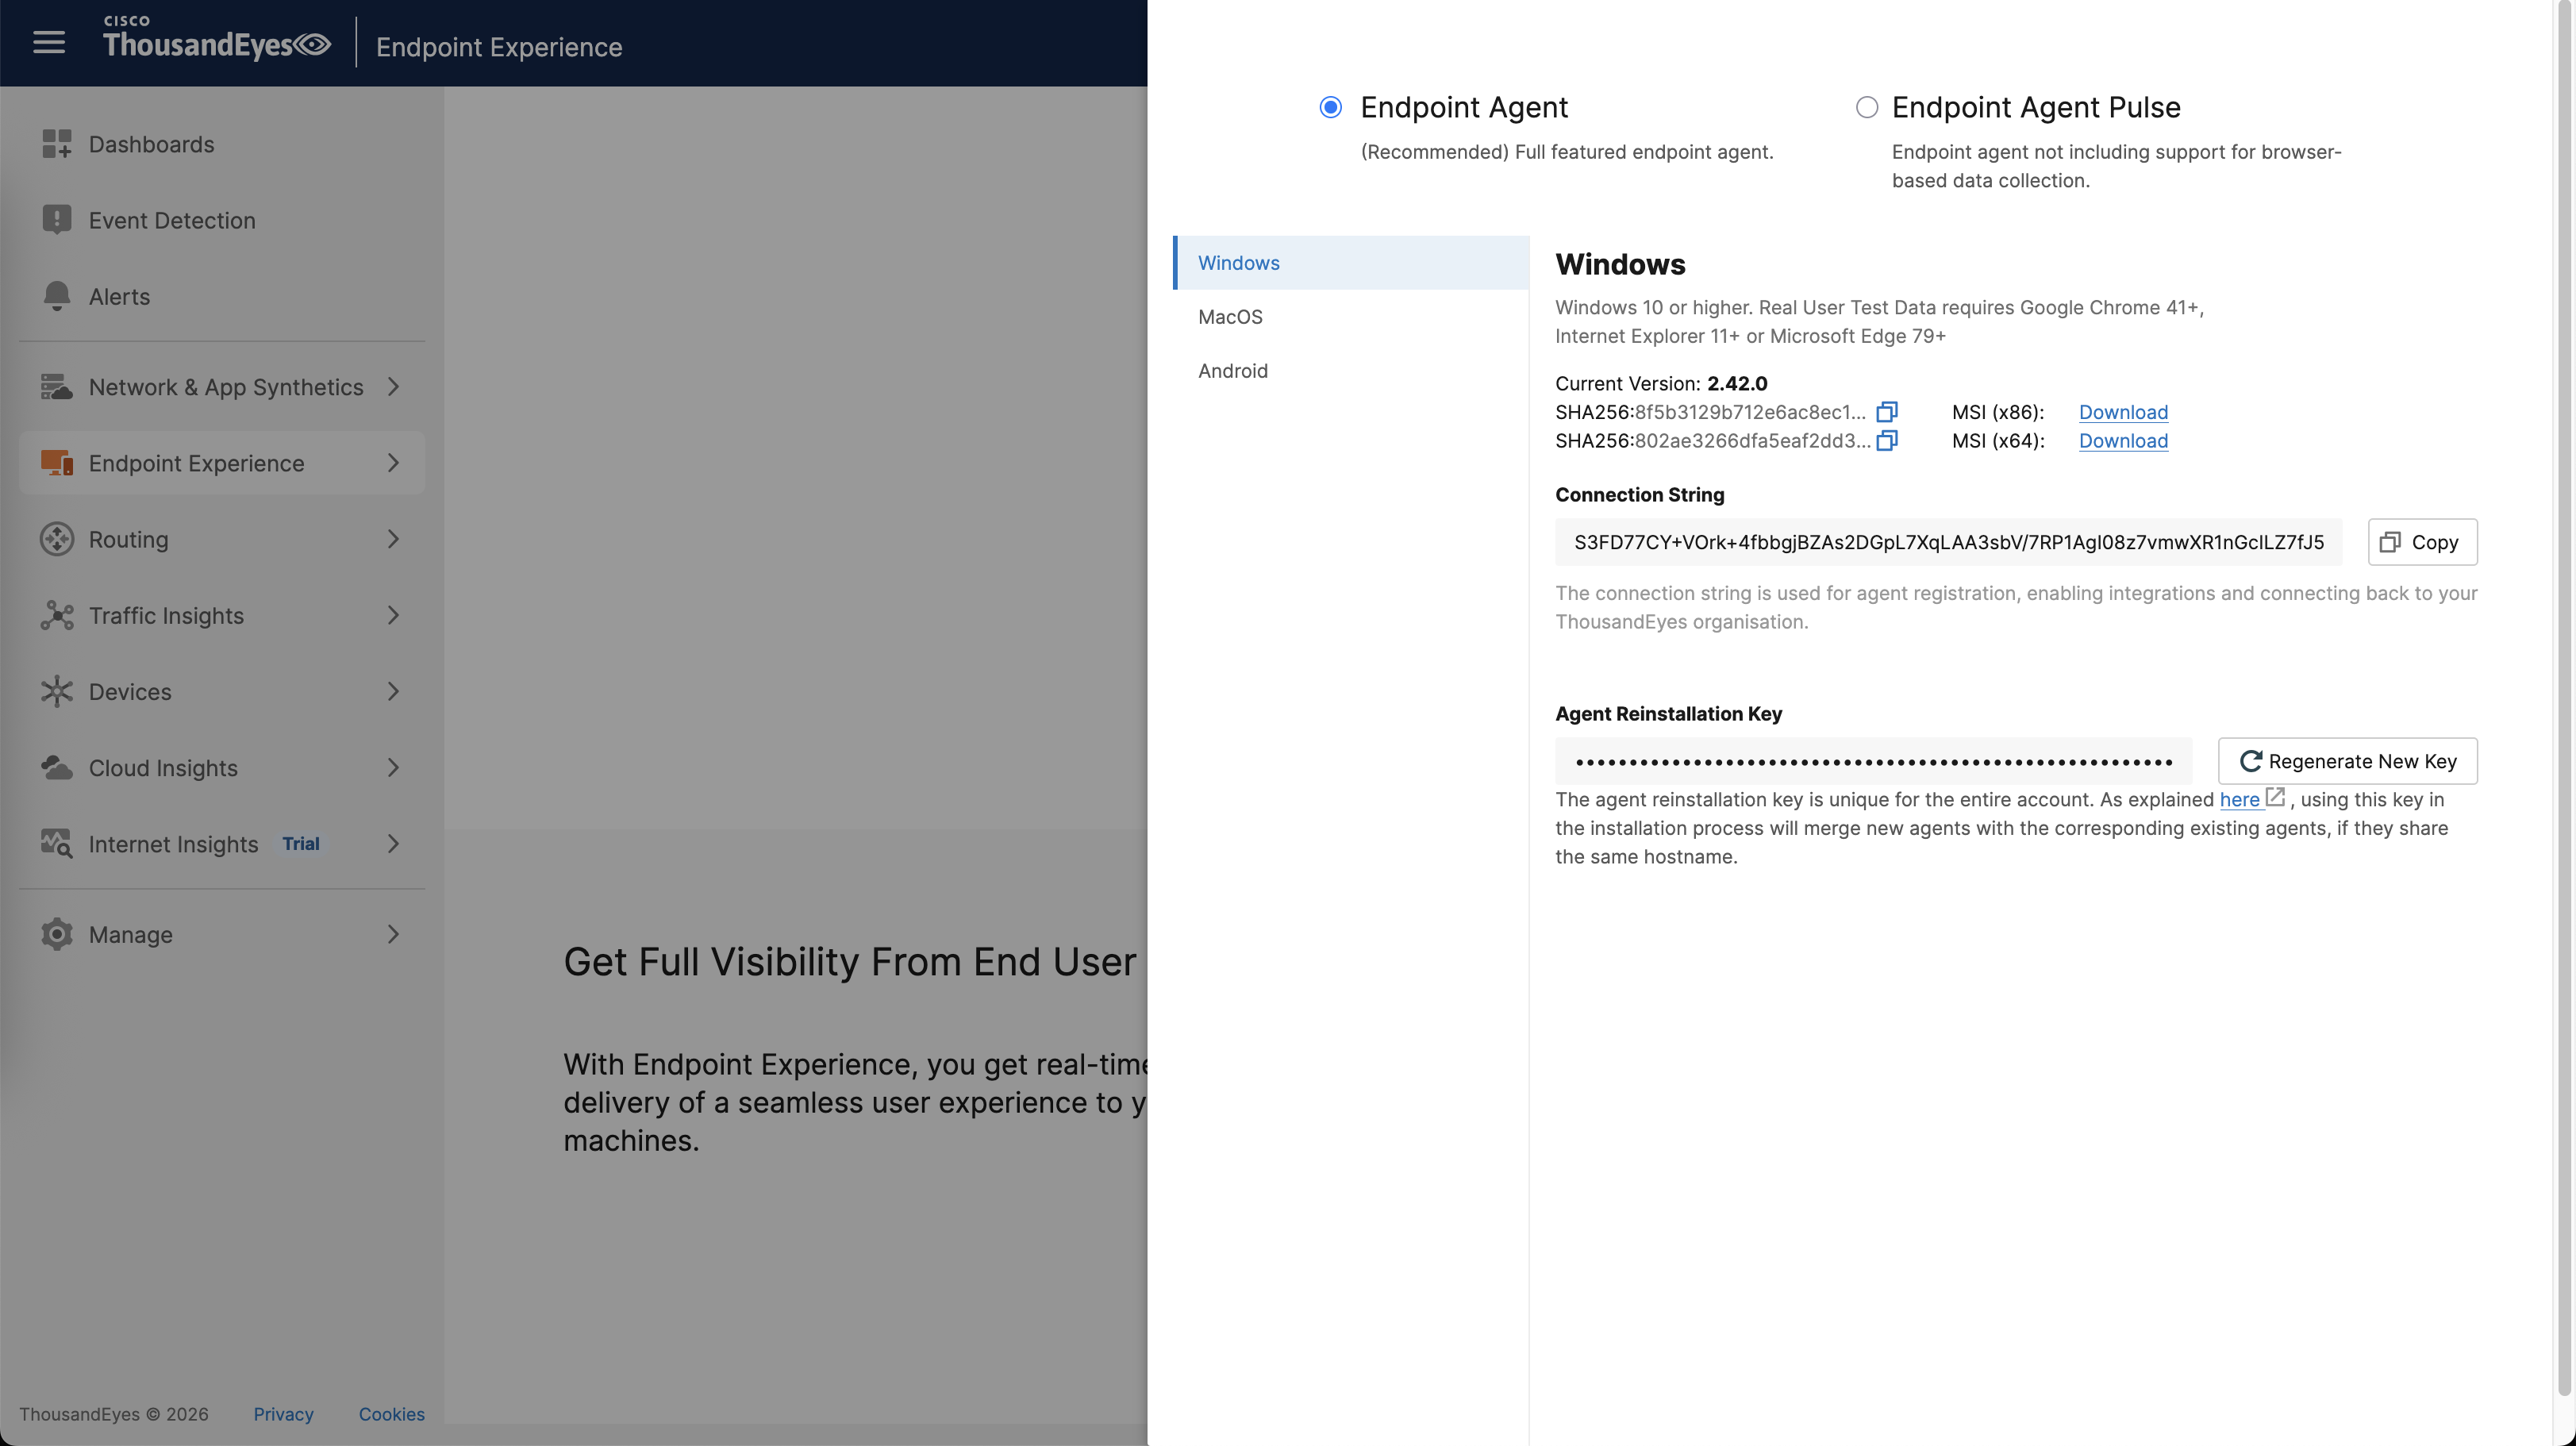
Then run the installer and enter the token
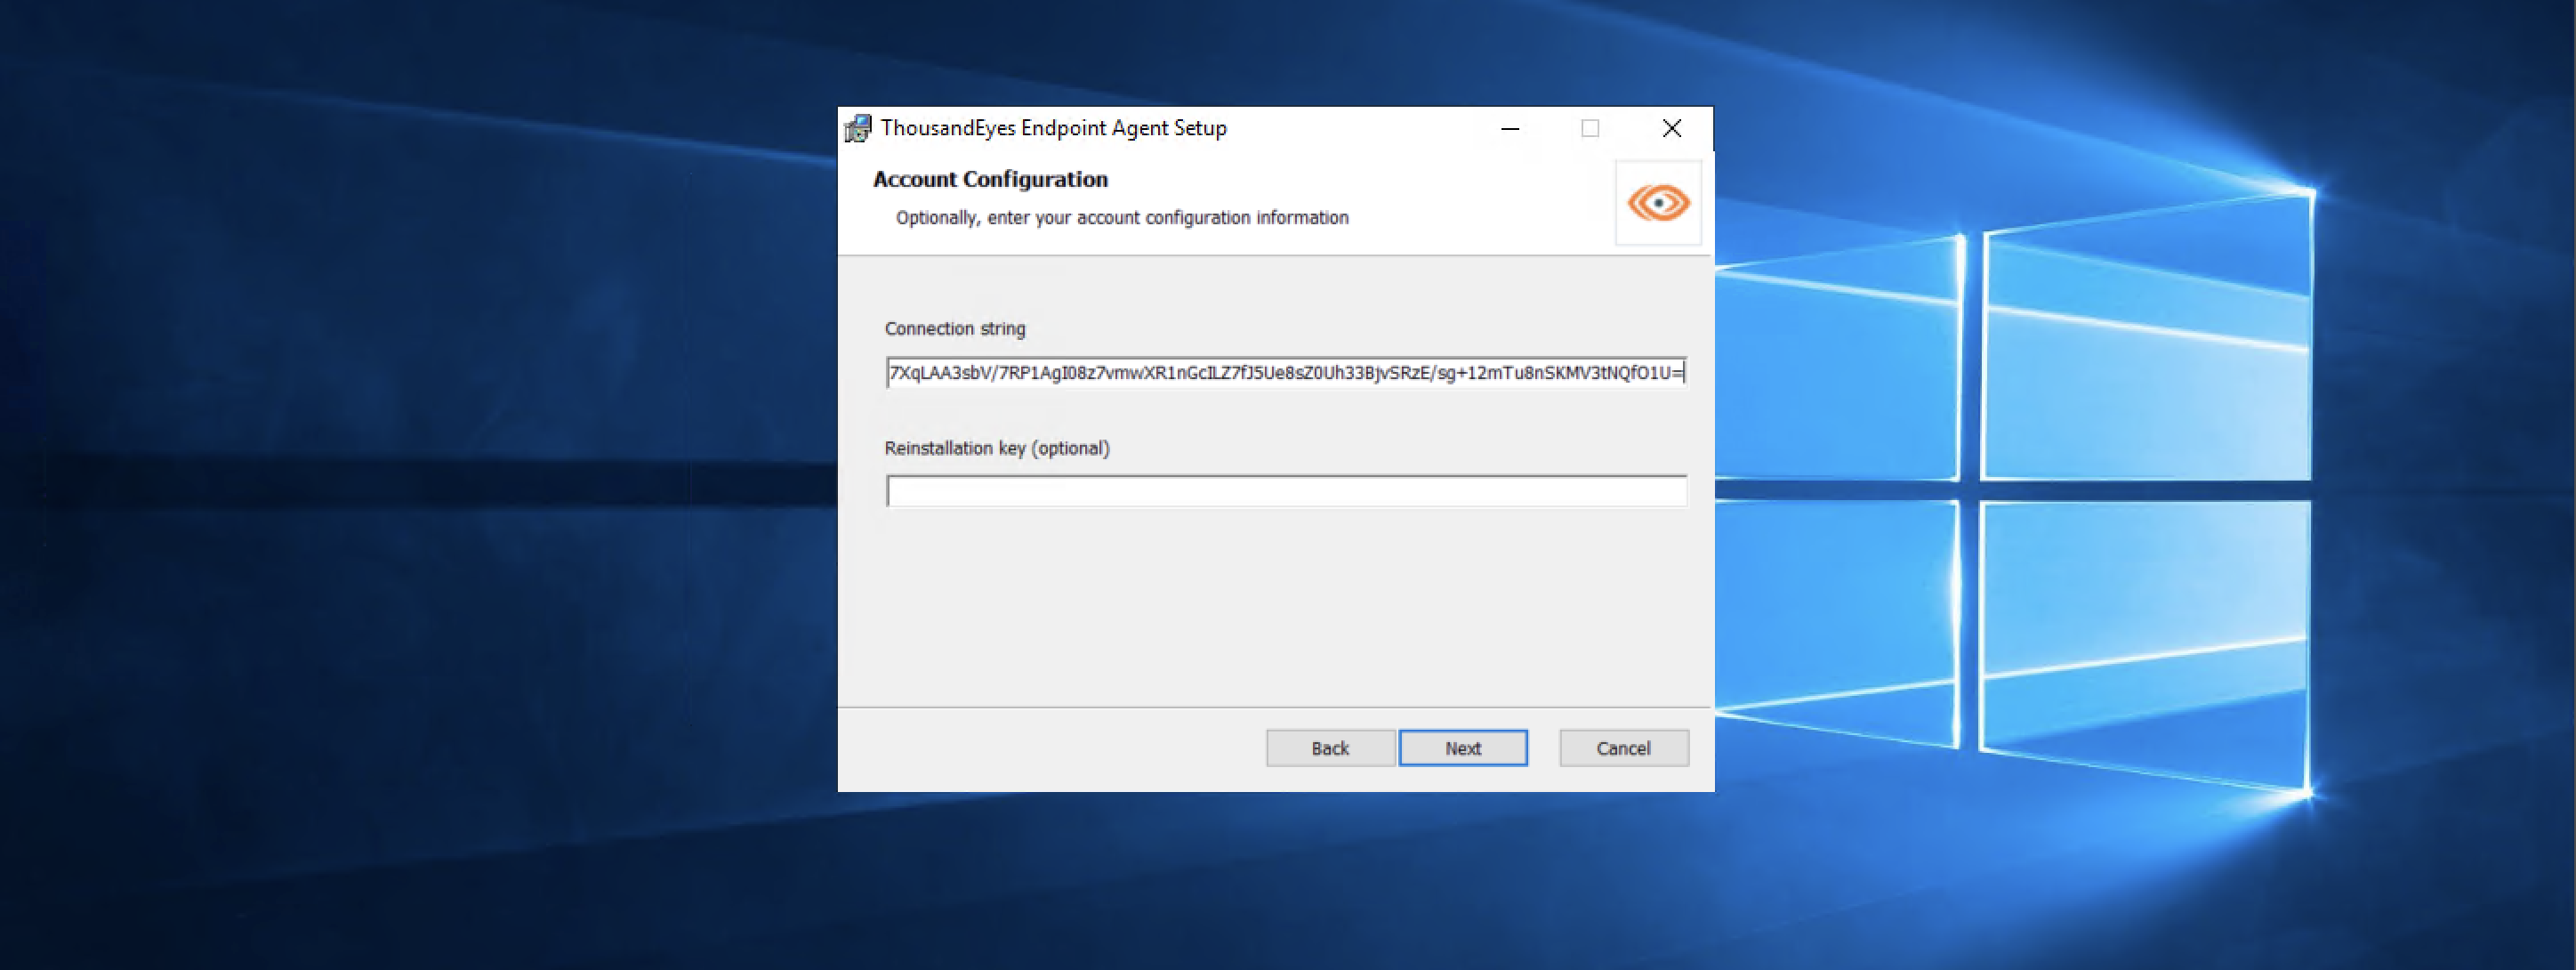
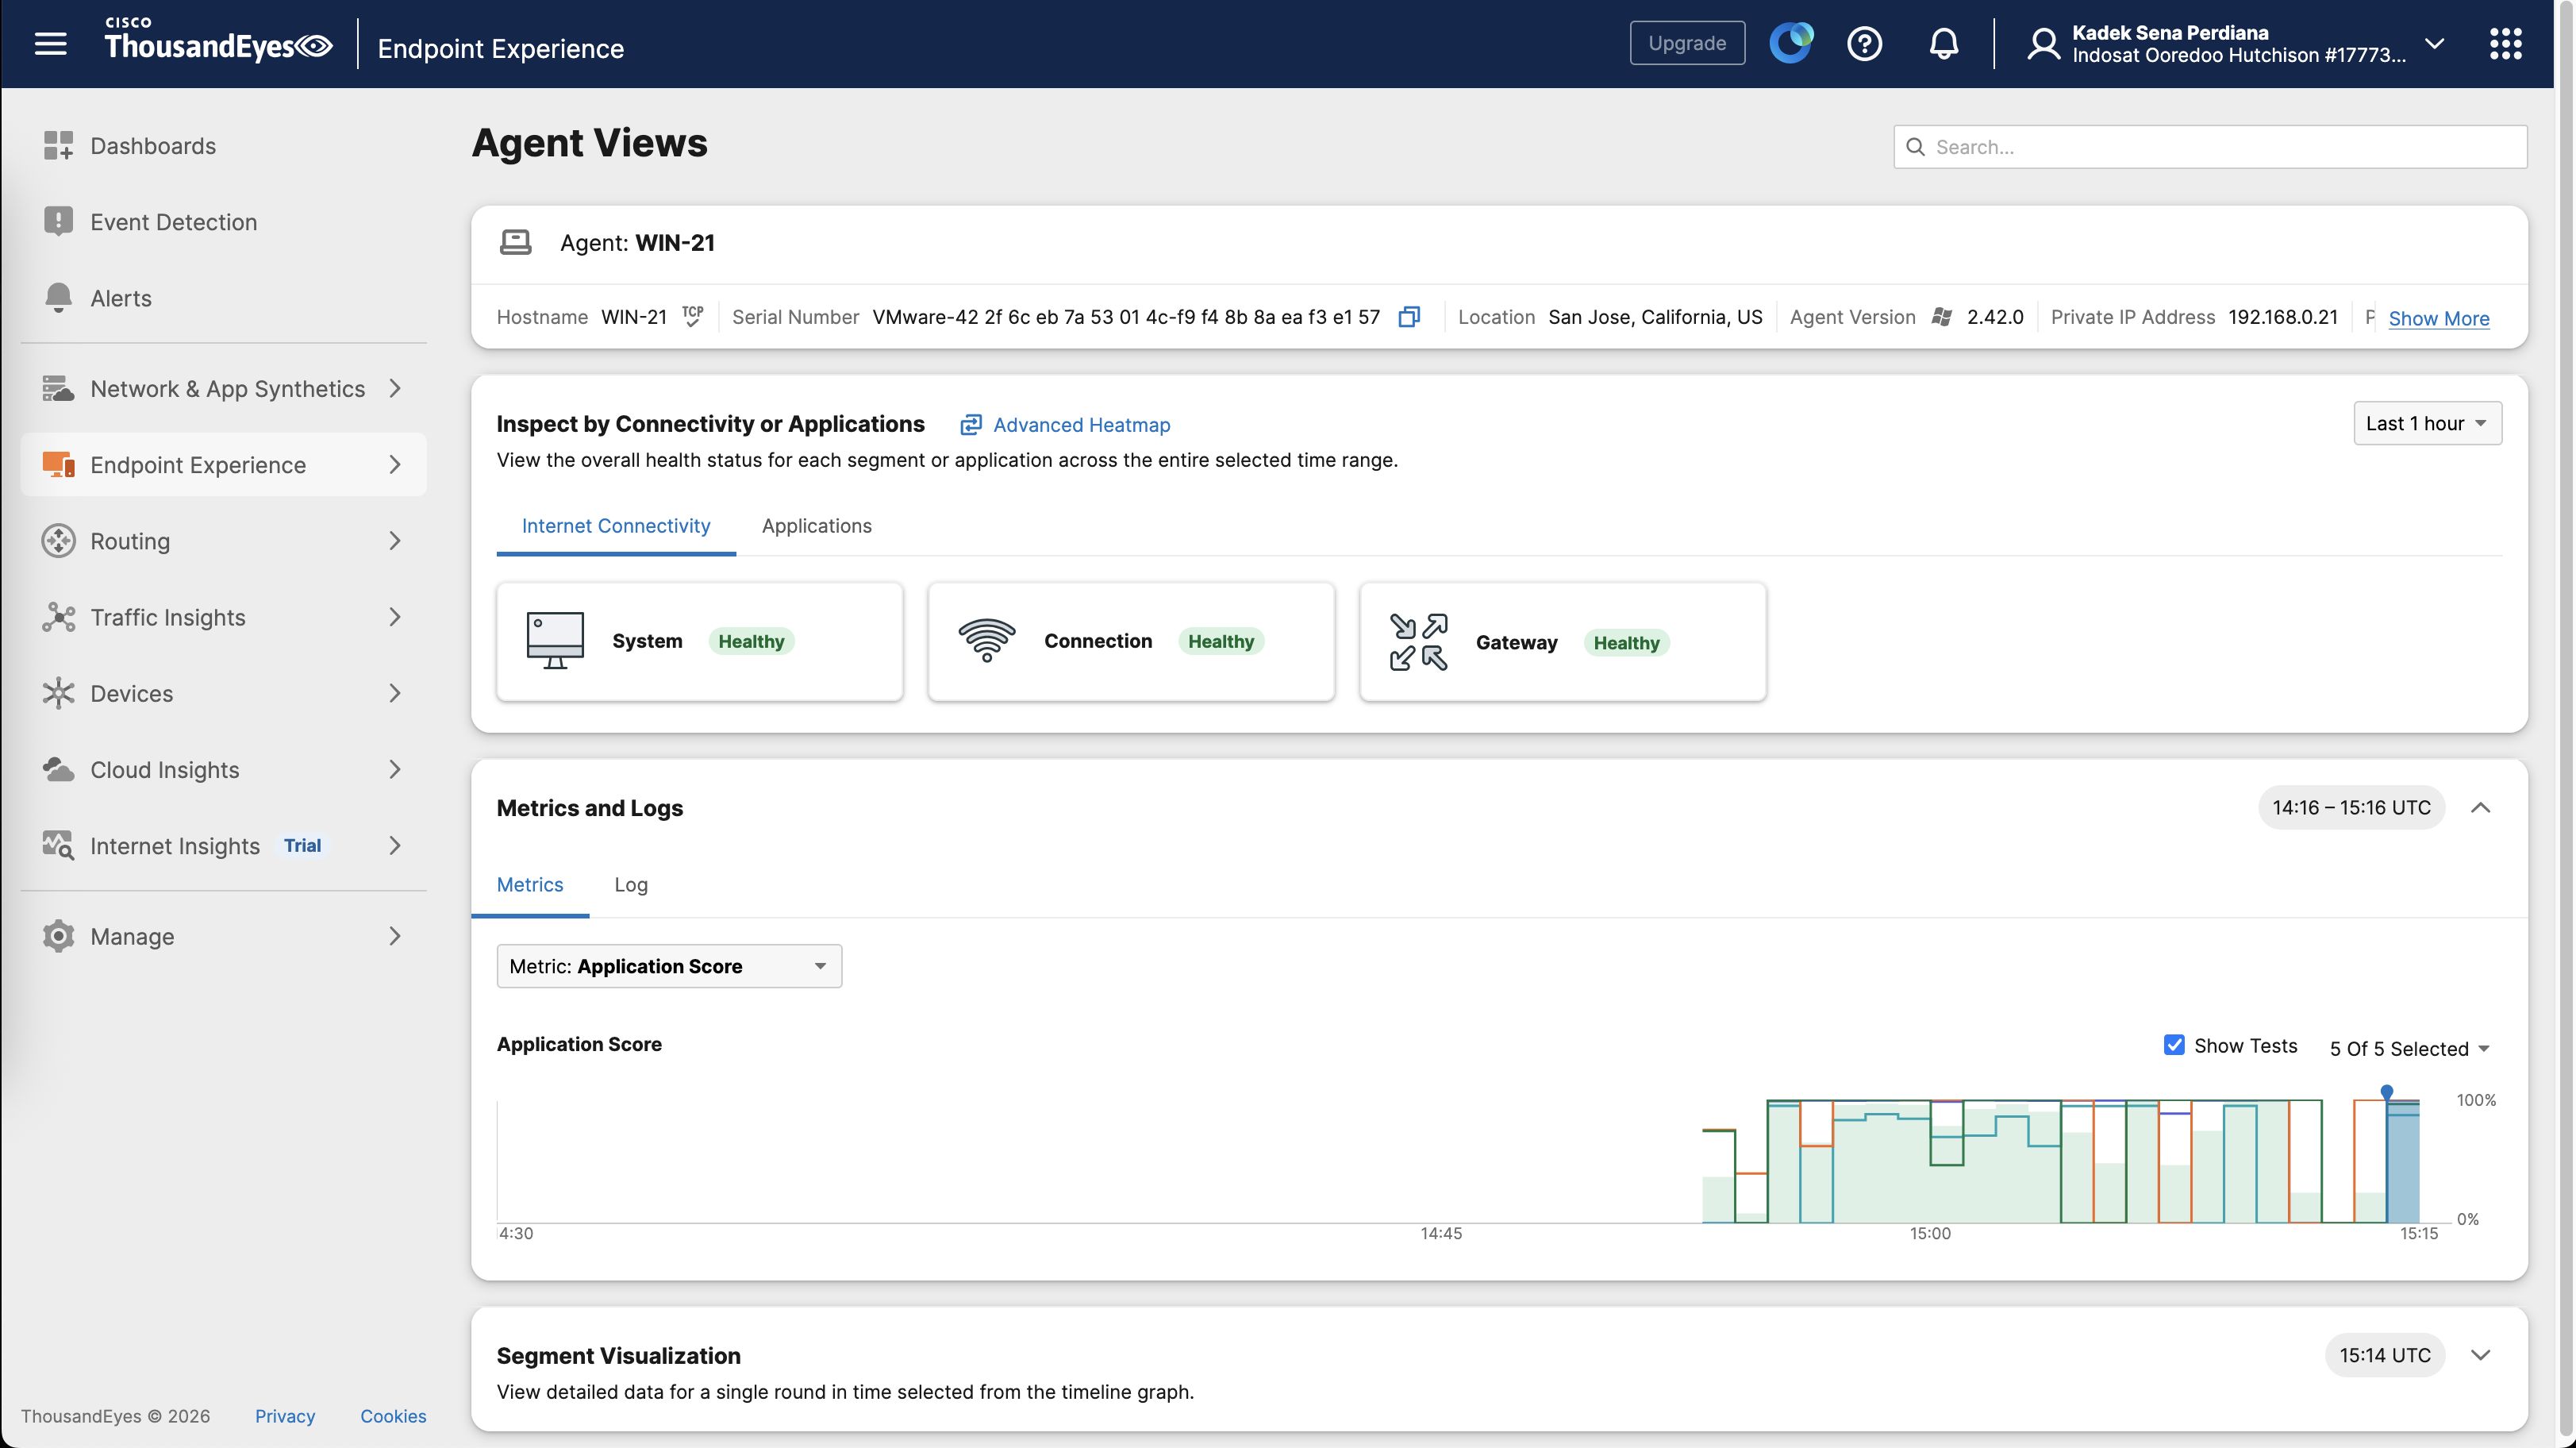
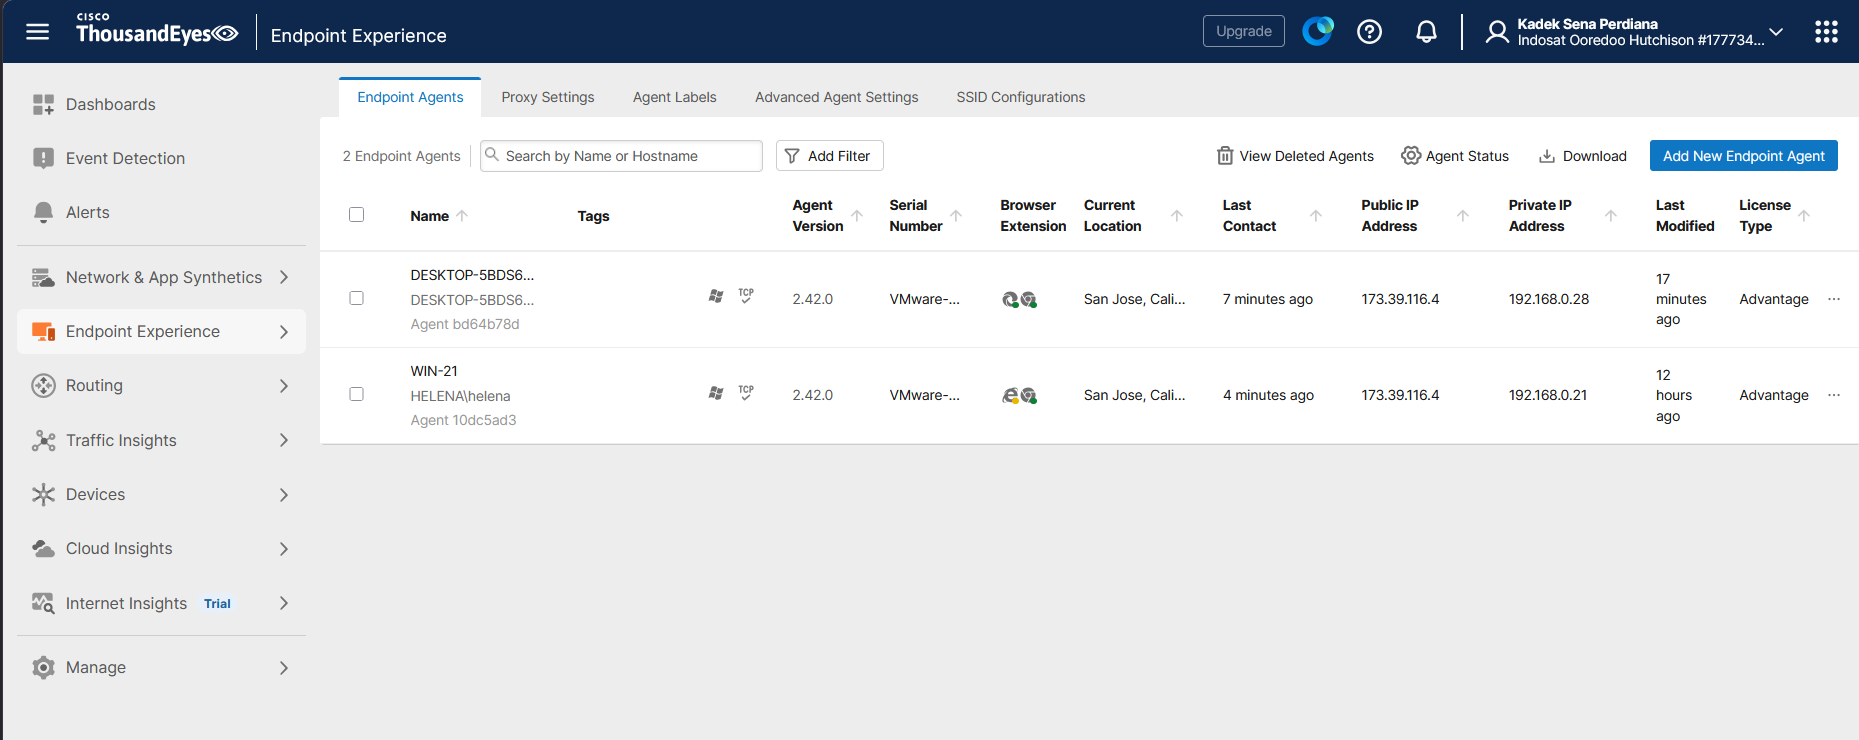
After that finishes, the computers should show up on our listed endpoint agents
Creating User Testing
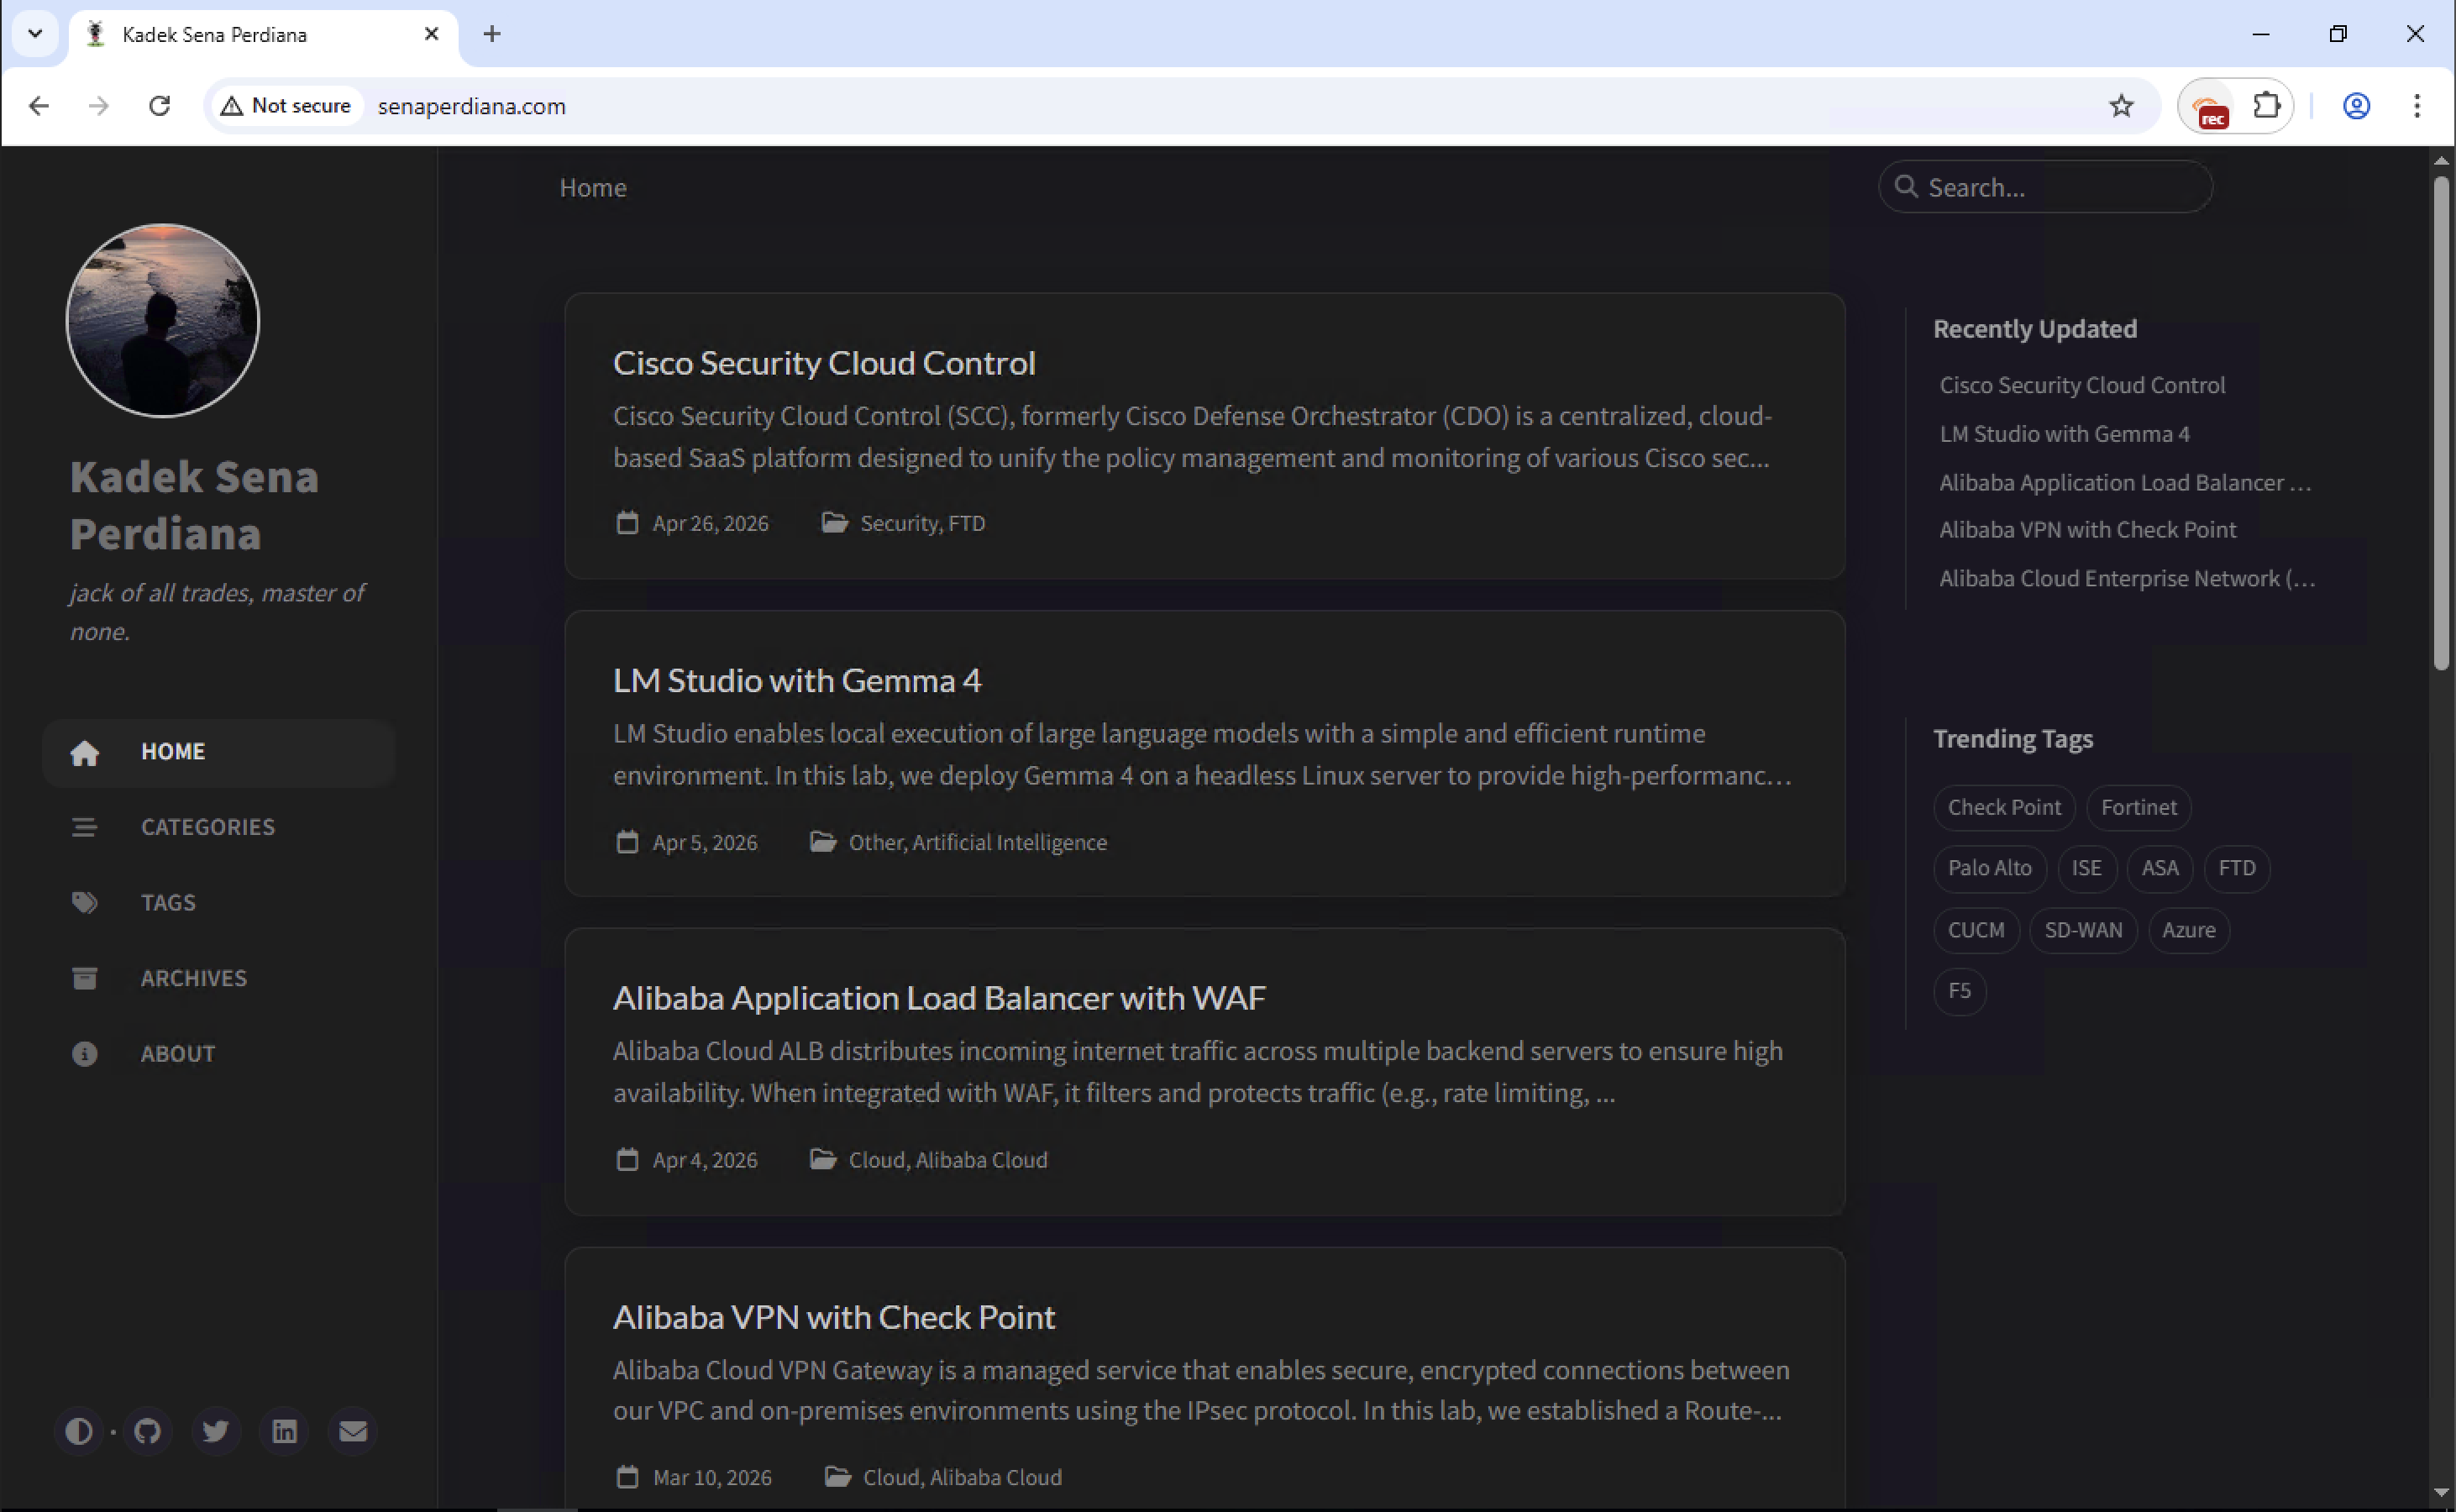
We basically have 2 testing types here, real test and synthetic test, first one is real test where we configure specified domain that users access through their browser so we can get some telemetry. Here we will configure senaperdiana.com
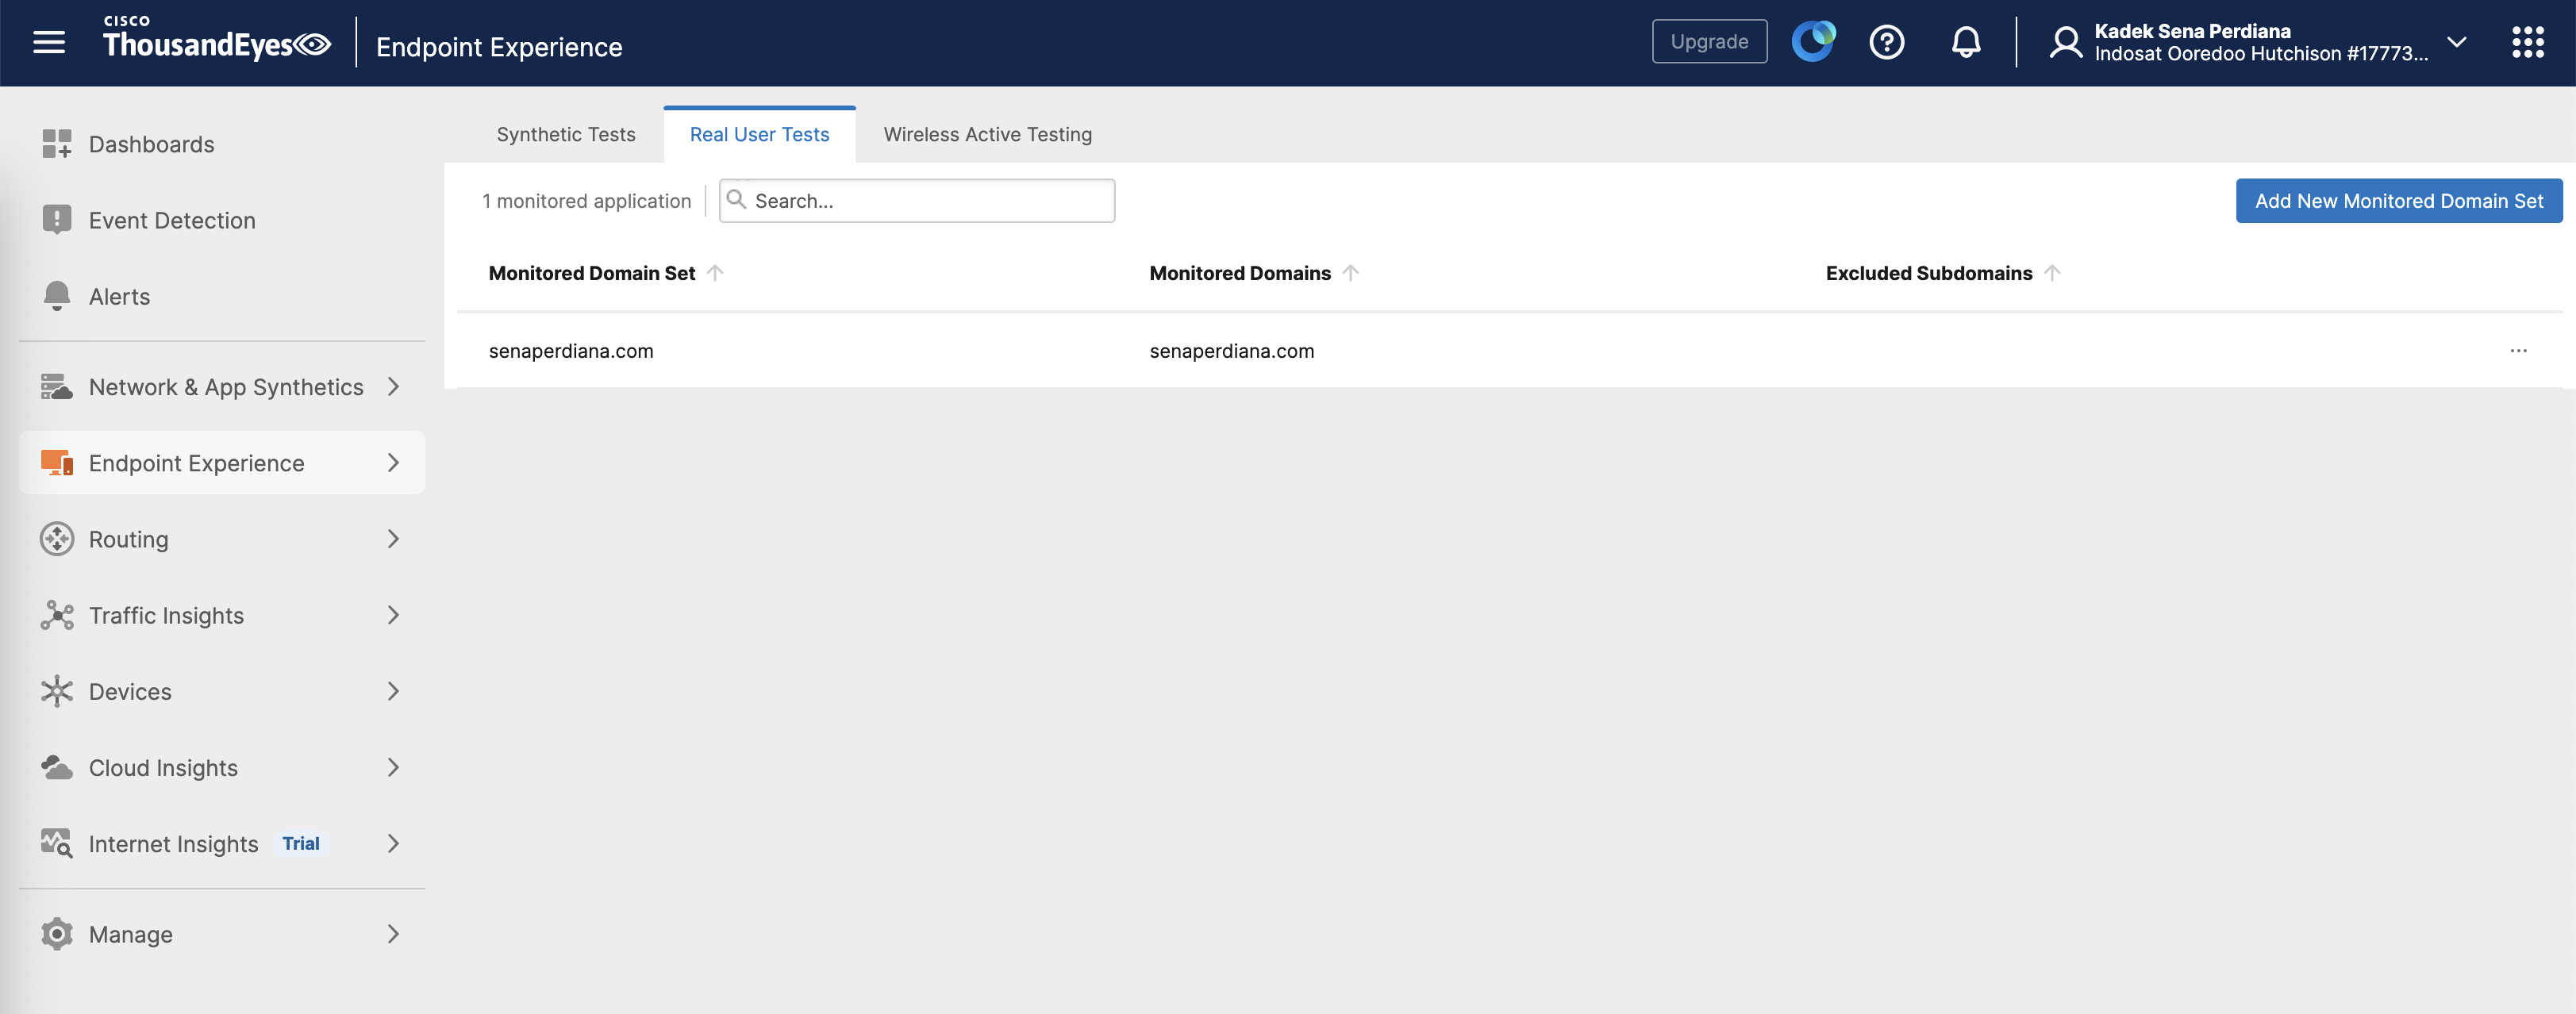
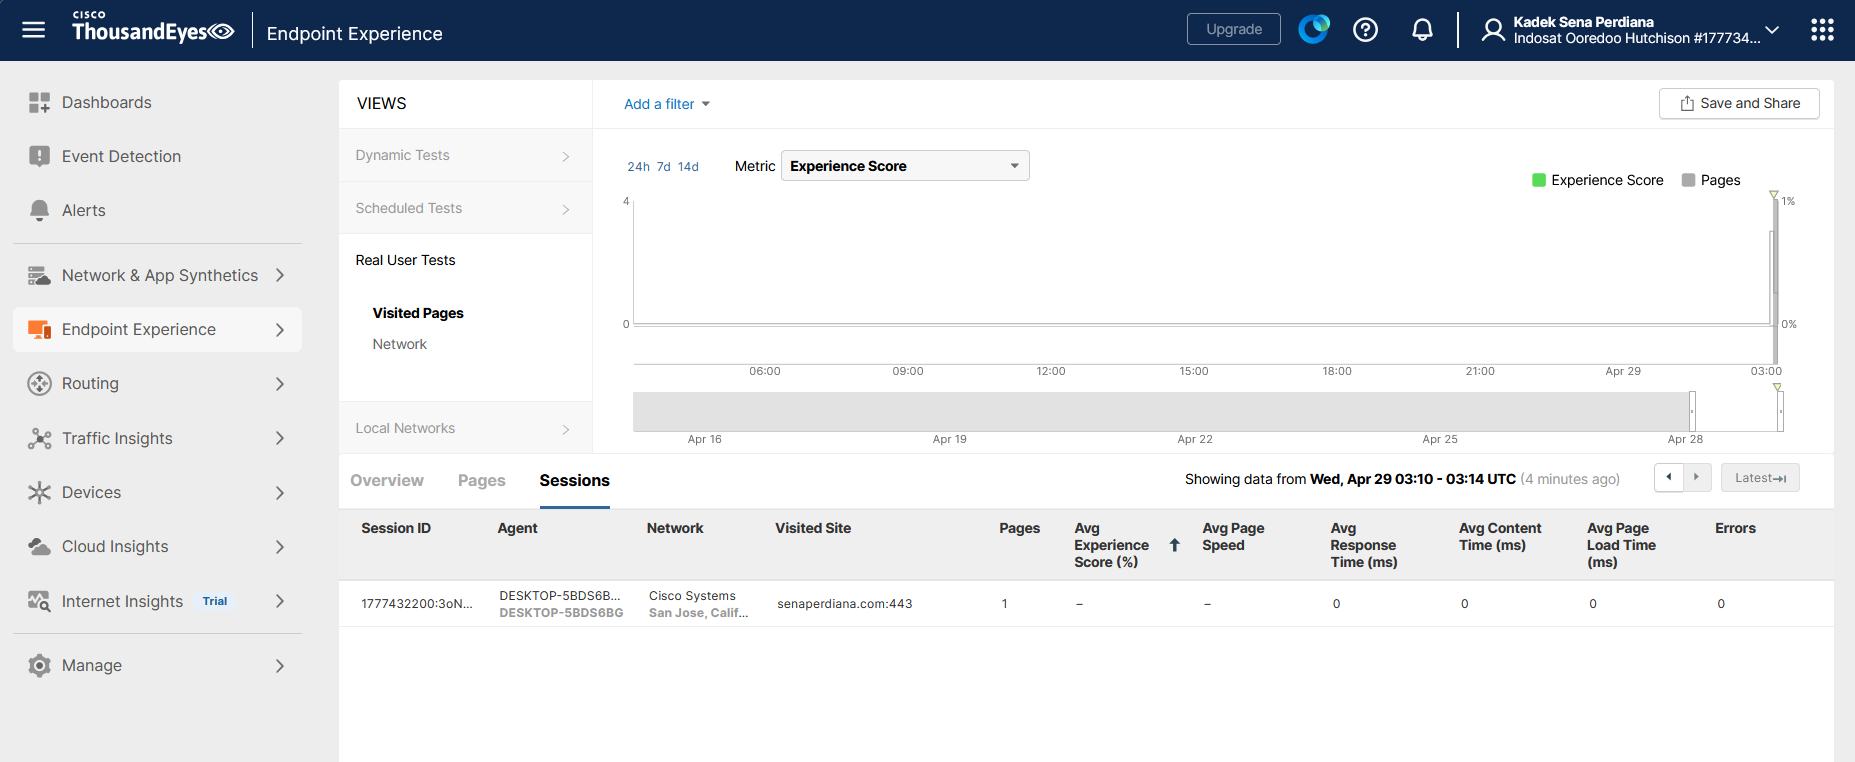
Now when users access senaperdiana.com, the installed extension will capture the data and send it to TE
Allowing us to monitor the user experience and the overall network health of that specified user
The other test is synthetic test, where we use the built-in templates that run periodically to get the network telemetry
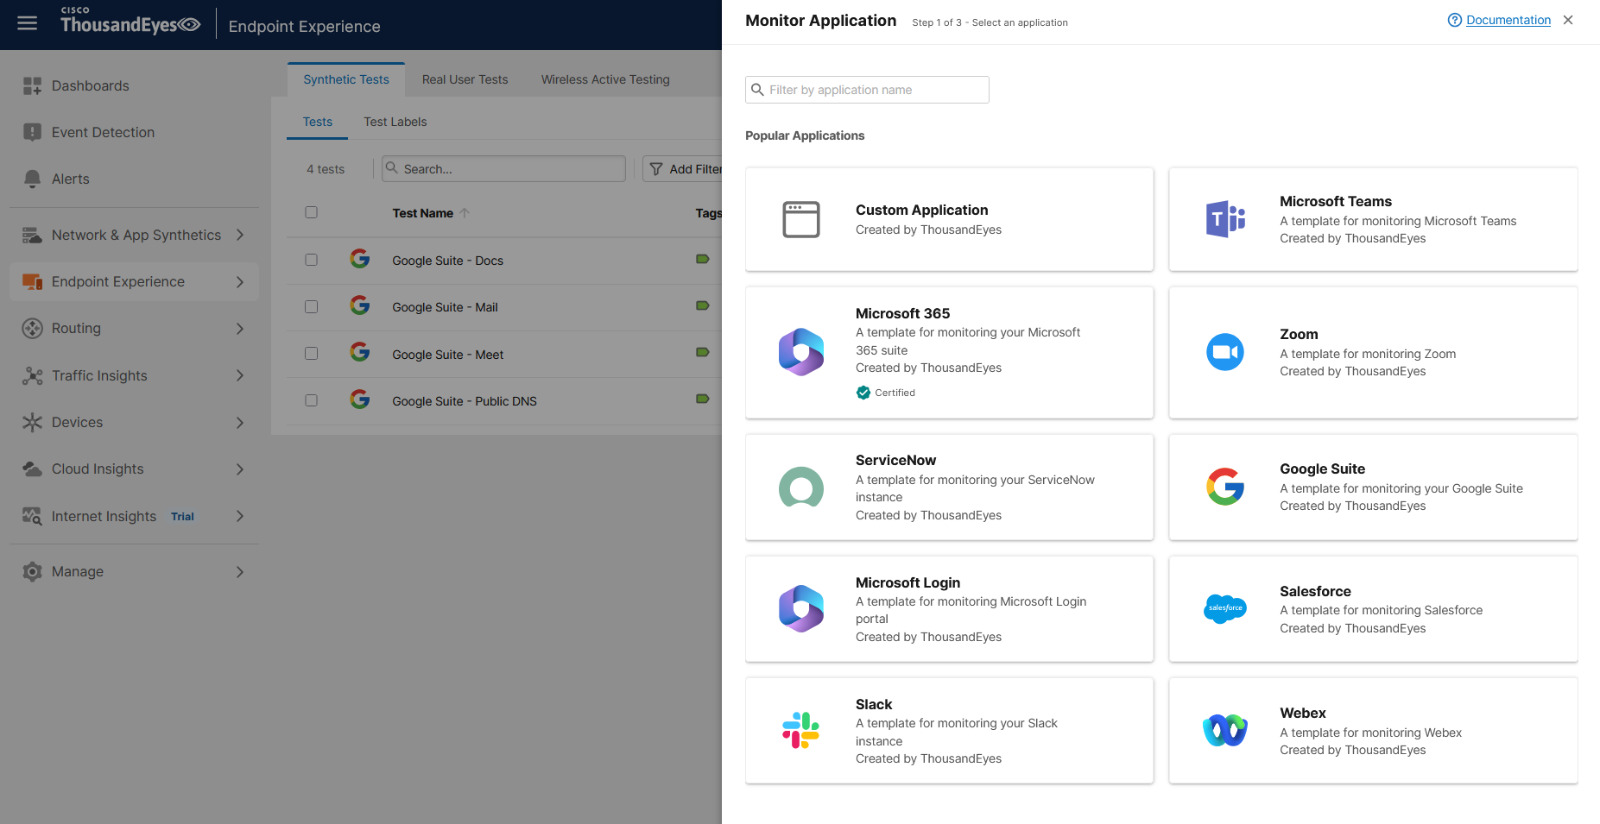
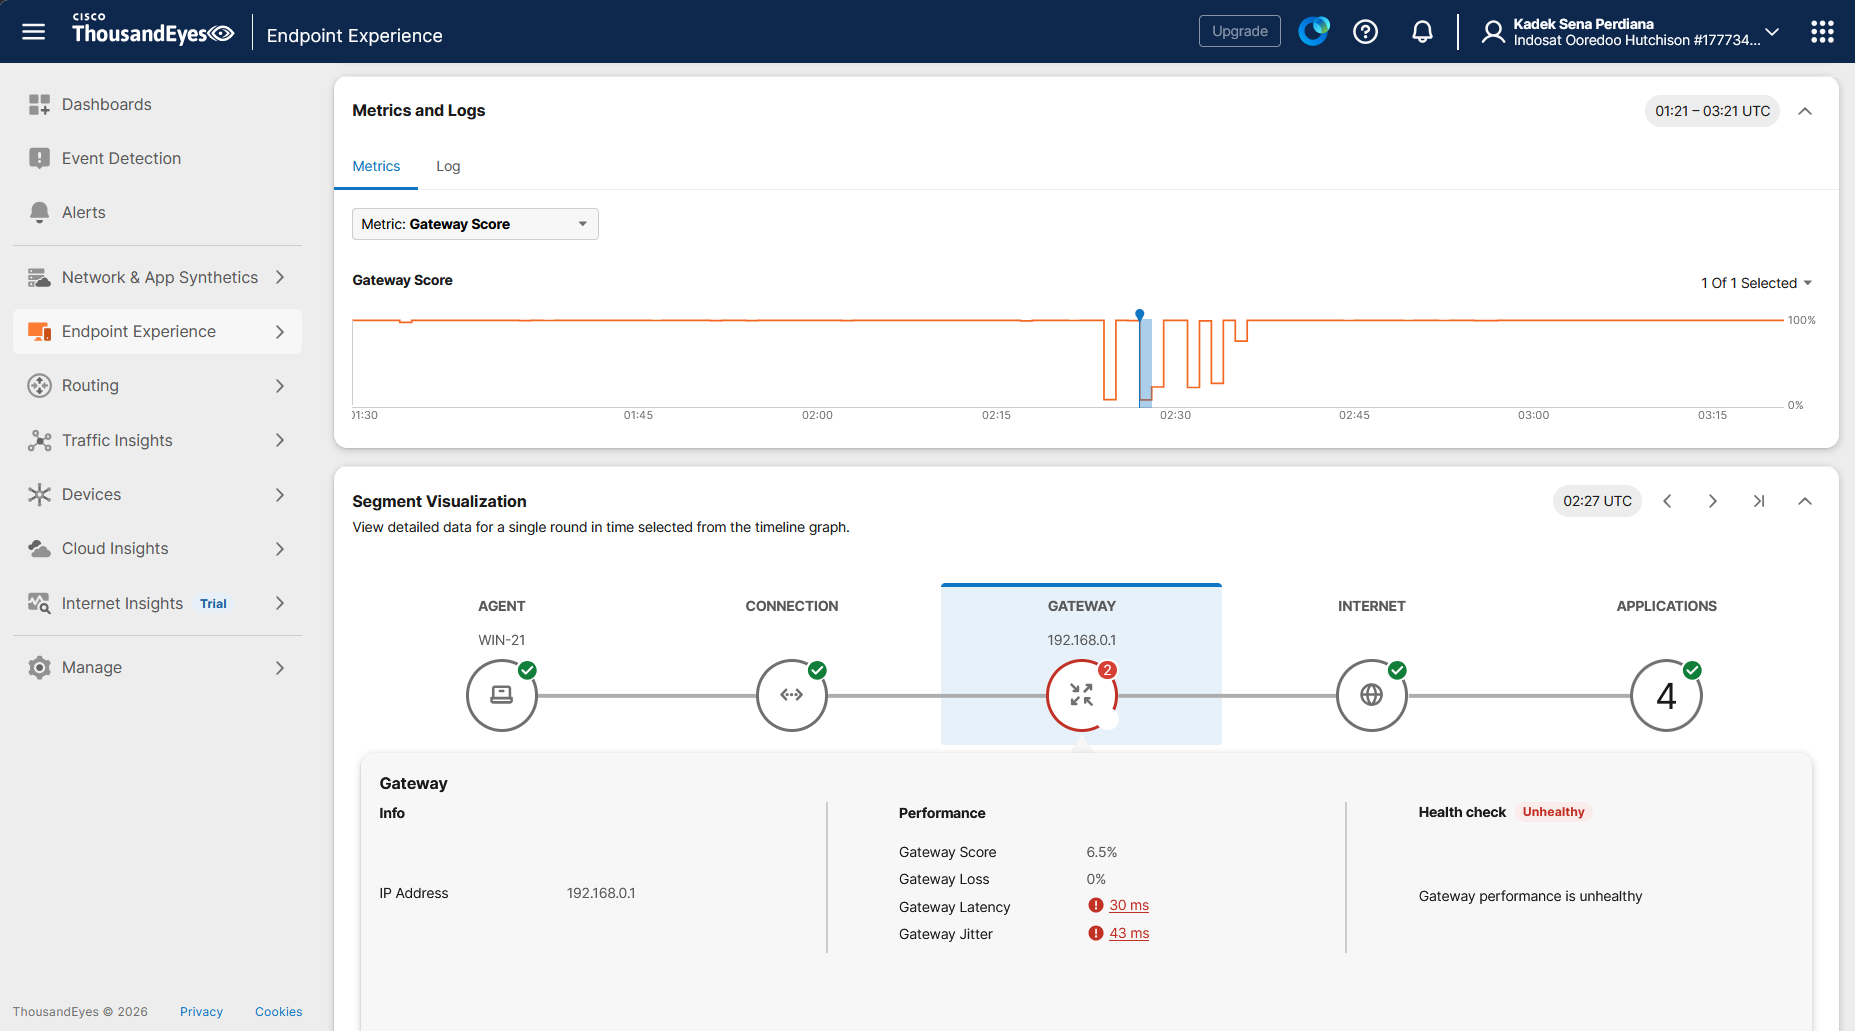
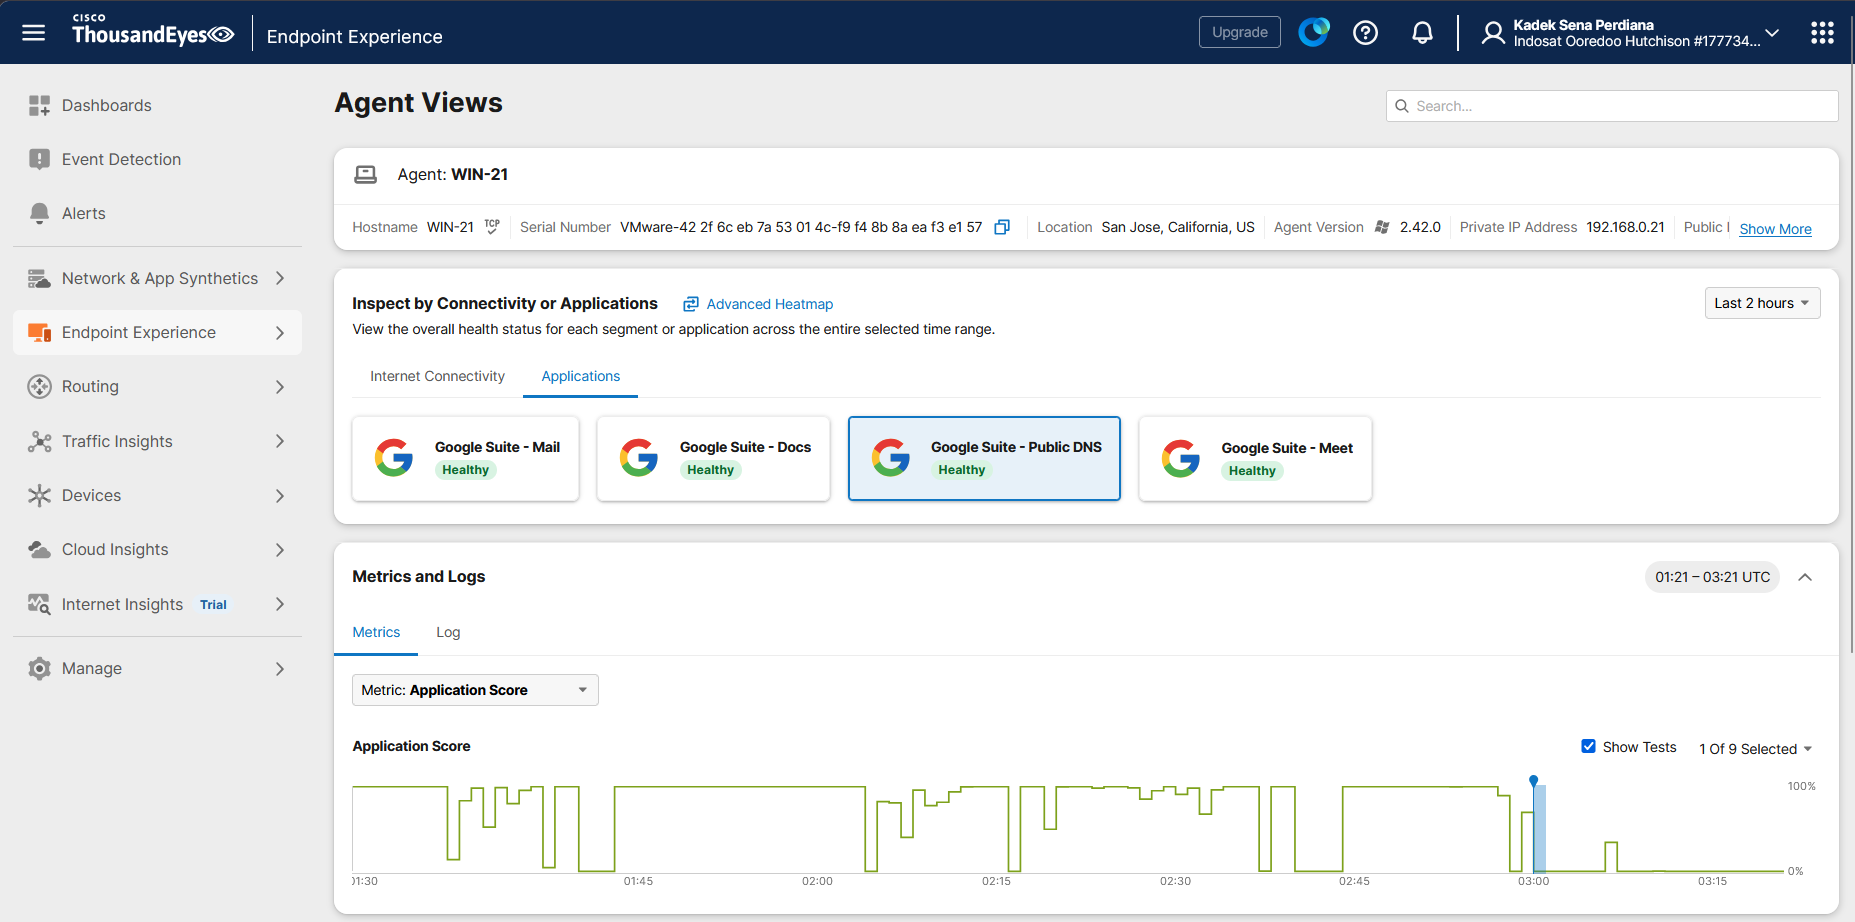
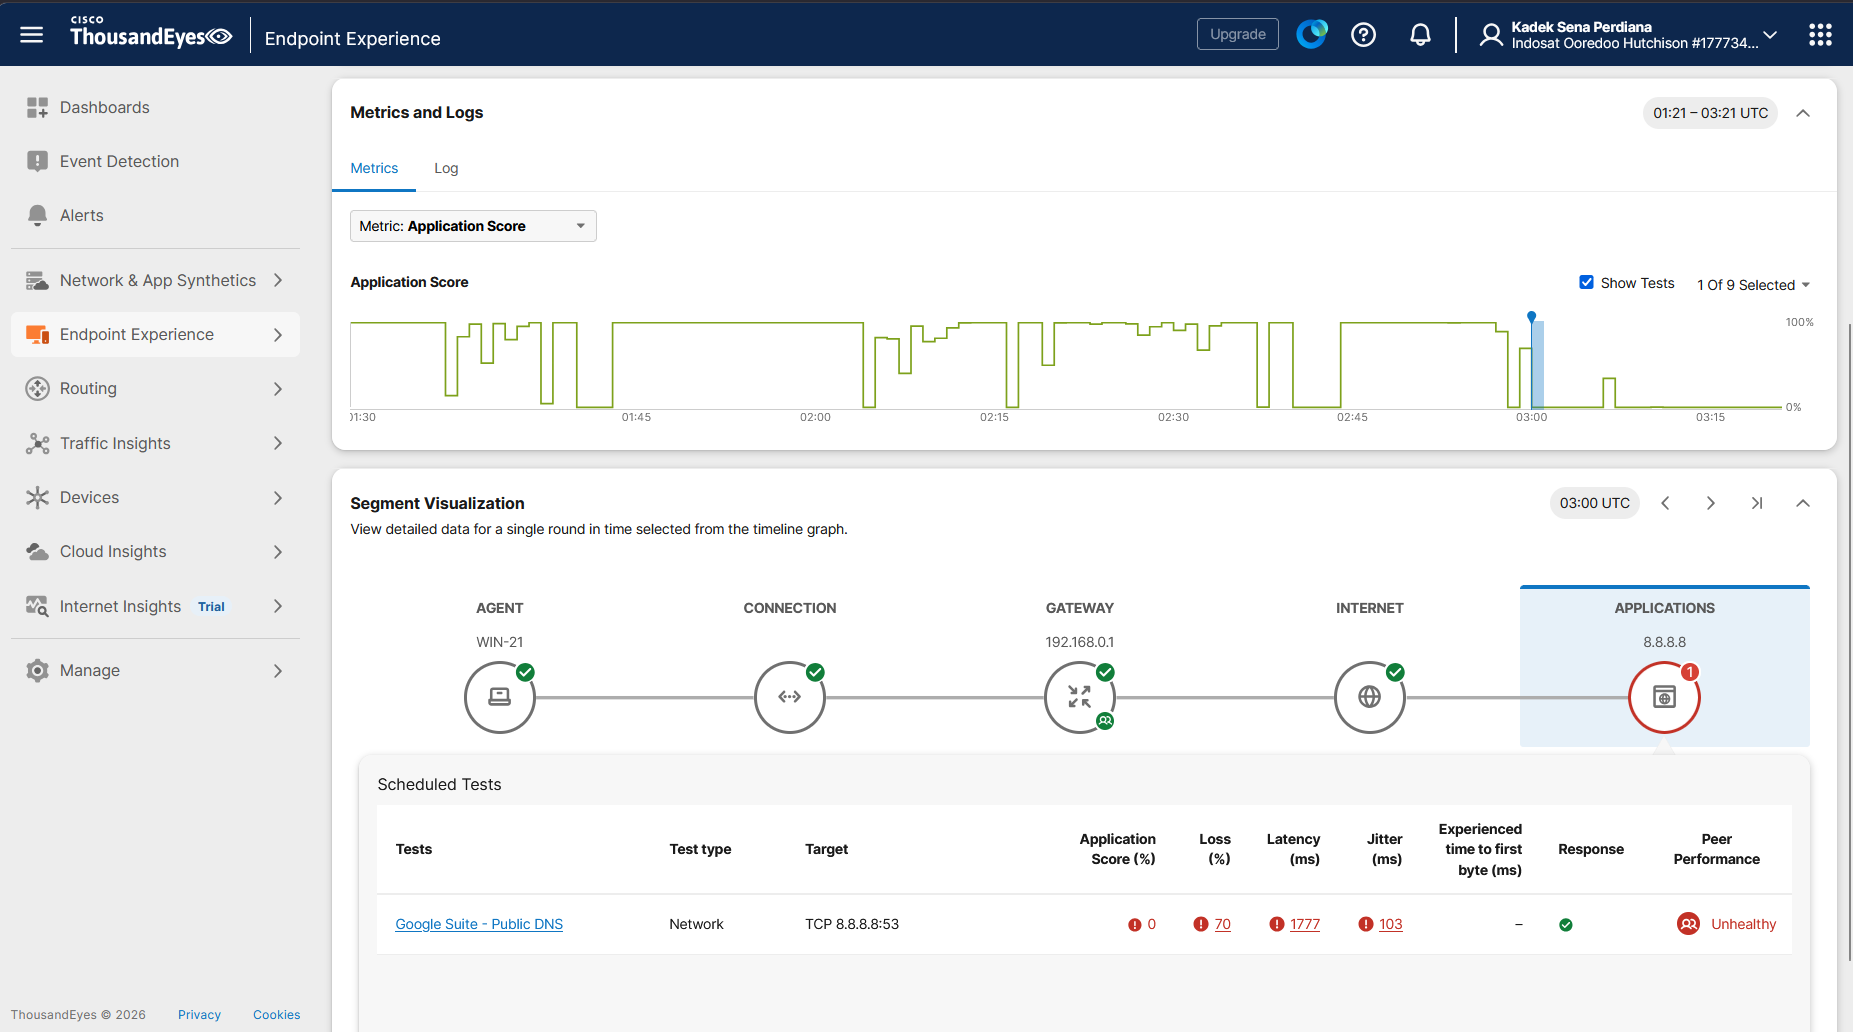
Here we configure the Google Suites template
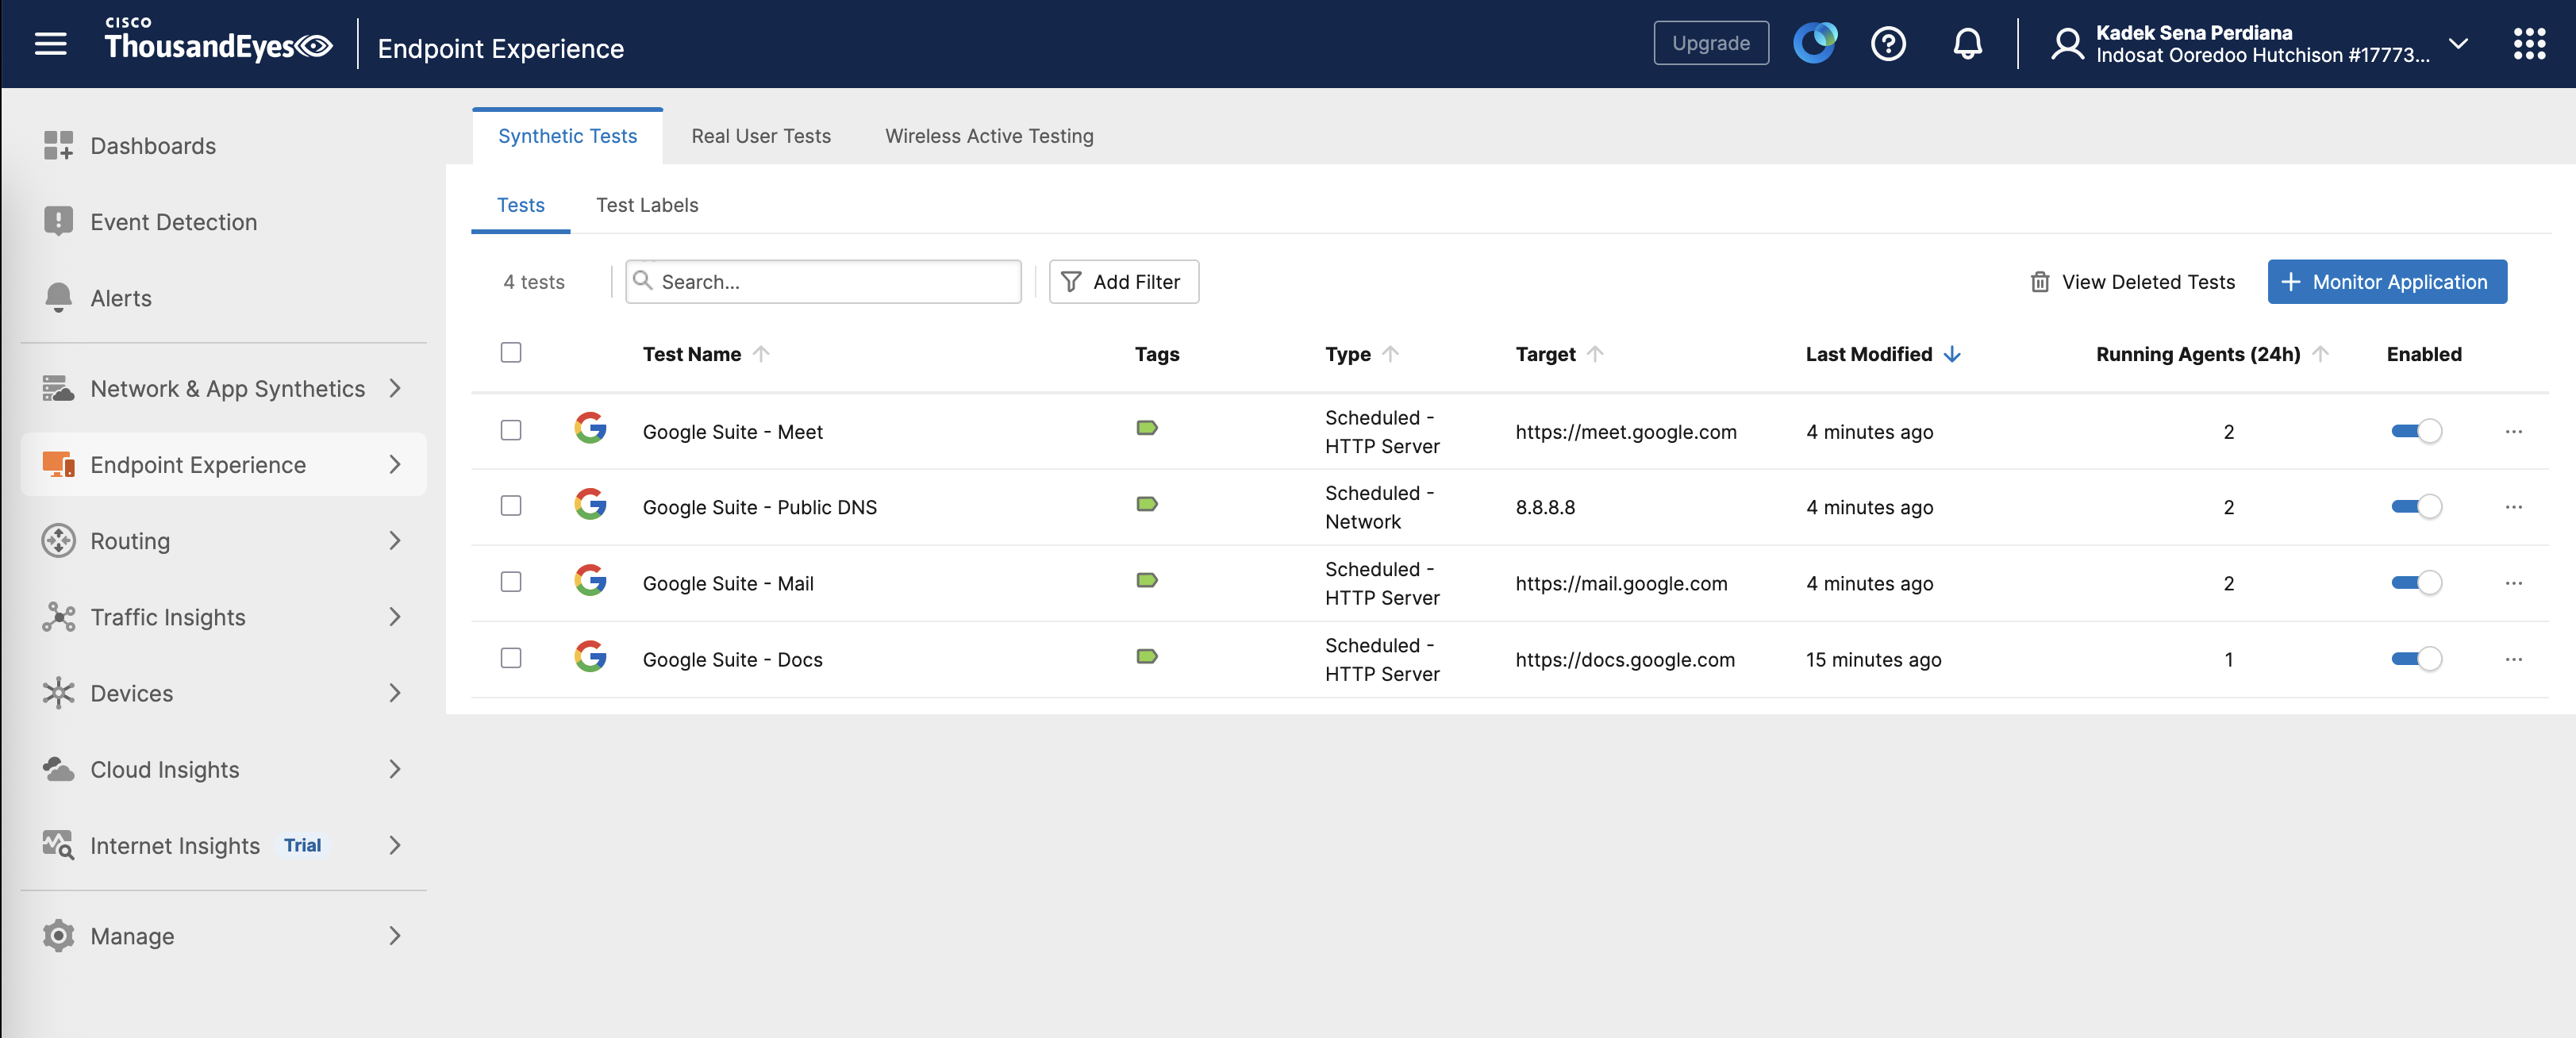
And after it runs for some time, we will start getting data and visualization on our TE Portal